Sustainable livestock farming: Progress since 1950

by Ilinca Anghelescu, Global Director Marketing Communications, EW Nutrition

Summary

  • Global GHG Emissions and Agriculture:
    • Agriculture-related emissions account for 31% of global anthropogenic emissions, with a growing share coming from food-related activities outside traditional farming, such as processing and transportation.
    • This represents a significant decrease from the 1950s when agriculture contributed to 58% of global emissions, a decrease largely due to the increased use of fossil fuels.
  • Population Growth and Emissions:
    • The global population has increased by 220% since 1950, leading to a threefold increase in agri-food emissions, now totaling 9-10 billion metric tons of CO2-equivalent annually.
  • Meat Production Growth:
    • Meat production has seen a 690% increase since 1950, driven by population growth, economic development, urbanization, technological advancements, and intensification of livestock production.
    • Technological improvements have significantly increased livestock yield, including higher carcass weights, improved feed efficiency, and greater output per animal.
  • Feed Conversion Ratio (FCR) as a Sustainability Metric:
    • FCR, which measures the efficiency of feed conversion into body mass, has improved dramatically for poultry, pigs, and cattle since the 1950s.
    • Improved FCR contributes to more efficient resource use, reduced environmental impact, better animal welfare, and economic viability.
  • Livestock Emissions and Land Use:
    • Livestock-related emissions have increased by 14% since 2000, with a significant portion coming from enteric fermentation in ruminants and land use changes.
    • Pasture and grazing land have expanded slightly, while the land for feed crops has increased substantially due to intensified livestock production.
  • Food Loss and Its Impact on Sustainability:
    • Food loss, occurring primarily before the consumer stage, remains stable at around 13%. Reducing food loss is critical for improving food security, economic efficiency, and minimizing the environmental footprint of livestock production.
  • Future Strategies for Sustainability:
    • The article emphasizes the need for ongoing investment in technology, optimization of feed efficiency, sustainable land use, and improved methods for tracking and reducing emissions to ensure the future sustainability of livestock farming.


As the global demand for animal products continues to rise, so do various claims about the impact of agriculture on greenhouse gas emissions. A study commissioned by the United Nations’ Food and Agriculture Organization (FAO) concluded that, according to the most recent data, agri-food system emissions totaled 16.5 billion metric tons of CO2 equivalent, representing 31% of global anthropogenic emissions.

Of these 31%, the most important trend highlighted by FAO was the “increasingly important role of food-related emissions generated outside of agricultural land, in pre- and post-production processes along food supply chains”. The food supply chain (food processing, packaging, transport, household consumption and waste disposal) is thus set to become the top GHG emitter, above farming and land use.

How bad is 31%?

While 31% is a large figure, even this estimate represents a significant decrease from the 1950s, when agri-food emissions constituted approximately 58% of total anthropogenic emissions: “From 1850 until around 1950, anthropogenic CO2 emissions were mainly (>50%) from land use, land-use change and forestry”, states the latest IPCC report.

Anthropogenic Emissions SourcesFigure 1. Source: IPCC AR6 Report, 2023. LULUCF = Land Use, Land-Use Change and Forestry

As the IPCC graph in Figure 1 indicates, the percentage decrease is mostly due to the rising prevalence of oil and coal in CO2 emissions over the recent decades, as shown in Figure 2 below.

Annual greenhouse gas (GHG) emissions worldwide from 1990 to 2022, by sector (in million metric tons of carbon dioxide equivalent)

Annual GHG Emissions By SectorFigure 2. Source: Statista

Total population and agri-food emission changes, 1950 – today

The global population increased by approximately 220%, from 2.5 billion in 1950 to 8 billion in 2023. In the meantime, estimates suggest that, in the 1950s, agri-food systems were responsible for approximately 2-3 billion metric tons of CO2-equivalent (CO2e) emissions per year. This figure includes emissions from livestock, rice paddies, fertilizer use, and land-use change (e.g., deforestation for agriculture).

Assessments generally agree that today’s agri-food systems contribute approximately 9-10 billion metric tons of CO2e annually, a threefold increase from 1950. This includes emissions from agriculture (e.g., livestock, crop production), food processing, transportation, and land-use changes.

This increase is consistent with FAO’s new findings, of food chain climbing to the top of agri-food emitters.

But where did these increased emissions come from?

A look at the graph below gives us an indication: world poverty rate decreased massively between 1950 and today. While COVID brought a setback, the historical data would clearly indicate a correlation between the increased output in agri-food systems and the decreased rate of poverty.

World Poverty
Figure 3. Source: World Bank

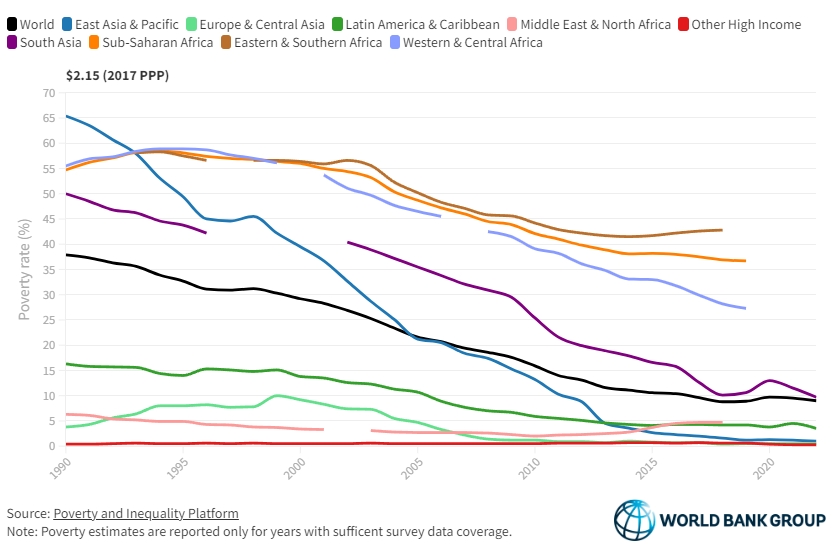
How did poverty rates decline so steeply? The reasons lie, to a large extent, in technological innovation, especially in genetics and farm management, and in the increased apport of plentiful and affordable meat protein to the world. The numbers below build an image of an industry that produces better, more, and cheaper.

Global meat production: 1950 vs. Present

Then…

In 1950, the estimated total meat production was of approximately 45 million metric tons.

Key Producers: The United States, Europe, and the Soviet Union were the primary producers of meat.
Types of Meat: Production was largely dominated by beef and pork, with poultry being less significant.

…and now

Now, the total meat production lies somewhere around 357 million metric tons (as of recent data from FAO)., representing a 53% increase from 2000 and a staggering 690% increase from 1950.

Key Producers: Major producers include China, the United States, Brazil, and the European Union.
Types of Meat: Significant increases in poultry production, with pork remaining a leading source of meat, especially in Asia. Beef production has also increased, but at a slower rate than poultry and pork.

Factors contributing to increased meat production

Population Growth: The world population has grown from approximately 2.5 billion in 1950 to over 8 billion today, driving increased demand for meat.

Economic Growth and Urbanization: Rising incomes and urbanization have led to shifts in economic power and dietary preferences, with more people consuming higher quantities of meat, especially in developing countries.

Technological Advancements: Improvements in animal breeding, feed efficiency, and production systems have increased the efficiency and output of meat production.

Intensification of Livestock Production: The shift from extensive to intensive livestock production systems has allowed for higher meat yields per animal.

Global Trade: Expansion of global trade in meat and meat products has facilitated the growth of production in countries with comparative advantages in livestock farming.

Livestock yield increase, 1950 to the present

The increase in livestock yield for cattle, pigs, and chickens between 1950 and the present has been significant due to advances in breeding, nutrition, management practices, and technology.

Beef

1950s

  • Average Carcass Weight: In the 1950s, the average carcass weight of beef cattle was about 200 to 250 kilograms (440 to 550 pounds).
  • Dressing Percentage: The dressing percentage (the proportion of live weight that becomes carcass) was typically around 50-55%.

Present Day

  • Average Carcass Weight: Today, the average carcass weight of beef cattle is approximately 300 to 400 kilograms (660 to 880 pounds).
  • Dressing Percentage: The dressing percentage has improved to about 60-65%.

Increase in Beef Cattle Yield

  • Increase in Carcass Weight: The average carcass weight has increased by about 100 to 150 kilograms (220 to 330 pounds) per animal.
  • Improved Dressing Percentage: The dressing percentage has increased by about 5-10 percentage points, meaning a greater proportion of the live weight is converted into meat.

Dairy

1950s

  • Average Milk Yield per Cow: Approximately 2,000 to 3,000 liters per year, depending on the region.

Present Day

  • Average Milk Yield per Cow: Approximately 8,000 to 10,000 liters per year globally, with some countries like the United States achieving even higher averages of 10,000 to 12,000 liters per year.

Increase in Milk Yield:: Milk yield per cow has increased about 4-5 times due to genetic selection, improved nutrition, technological advancements, and better herd management.

Chickens (Layers)

1950s

  • Average Egg Production per Hen: In the 1950s, a typical laying hen produced about 150 to 200 eggs per year.

Present Day

  • Average Egg Production per Hen: Today, a typical laying hen produces approximately 280 to 320 eggs per year, with some high-performing breeds producing even more.

Increase in Egg Yield: The average egg production per hen has increased by approximately 130 to 170 eggs per year.

Chickens (Broilers)

1950s

  • Average Yield per Bird: In the 1950s, broiler chickens typically reached a market weight of about 1.5 to 2 kilograms (3.3 to 4.4 pounds) over a growth period of 10 to 12 weeks.

Present Day

  • Average Yield per Bird: Today, broiler chickens reach a market weight of about 2.5 to 3 kilograms (5.5 to 6.6 pounds) in just 5 to 7 weeks.

Increase in Yield: The average weight of a broiler chicken has increased by approximately 1 to 1.5 kilograms (2.2 to 3.3 pounds) per bird. Additionally, the time to reach market weight has been nearly halved.

Factors contributing to yield increases

Genetic Improvement:

  • Selective Breeding: Focused breeding programs have developed chicken strains with rapid growth rates and high feed efficiency, significantly increasing meat yield.

Nutrition:

  • Optimized Feed: Advances in poultry nutrition have led to feed formulations that promote faster growth and better health, using balanced diets rich in energy, protein, and essential nutrients.

Management Practices:

  • Housing and Environment: Improved housing conditions, including temperature and humidity control, have reduced stress and disease, enhancing growth rates.

Technological Advancements:

  • Automation: Automation in feeding, watering, and waste management has improved efficiency and bird health.
  • Health Monitoring: Advances in health monitoring and veterinary care have reduced mortality rates and supported faster growth.

Feed Conversion Efficiency:

  • Improved Feed Conversion Ratios (FCR): The amount of feed required to produce a unit of meat has decreased significantly, making production more efficient.

Why Feed Conversion Ratio is a sustainability metric

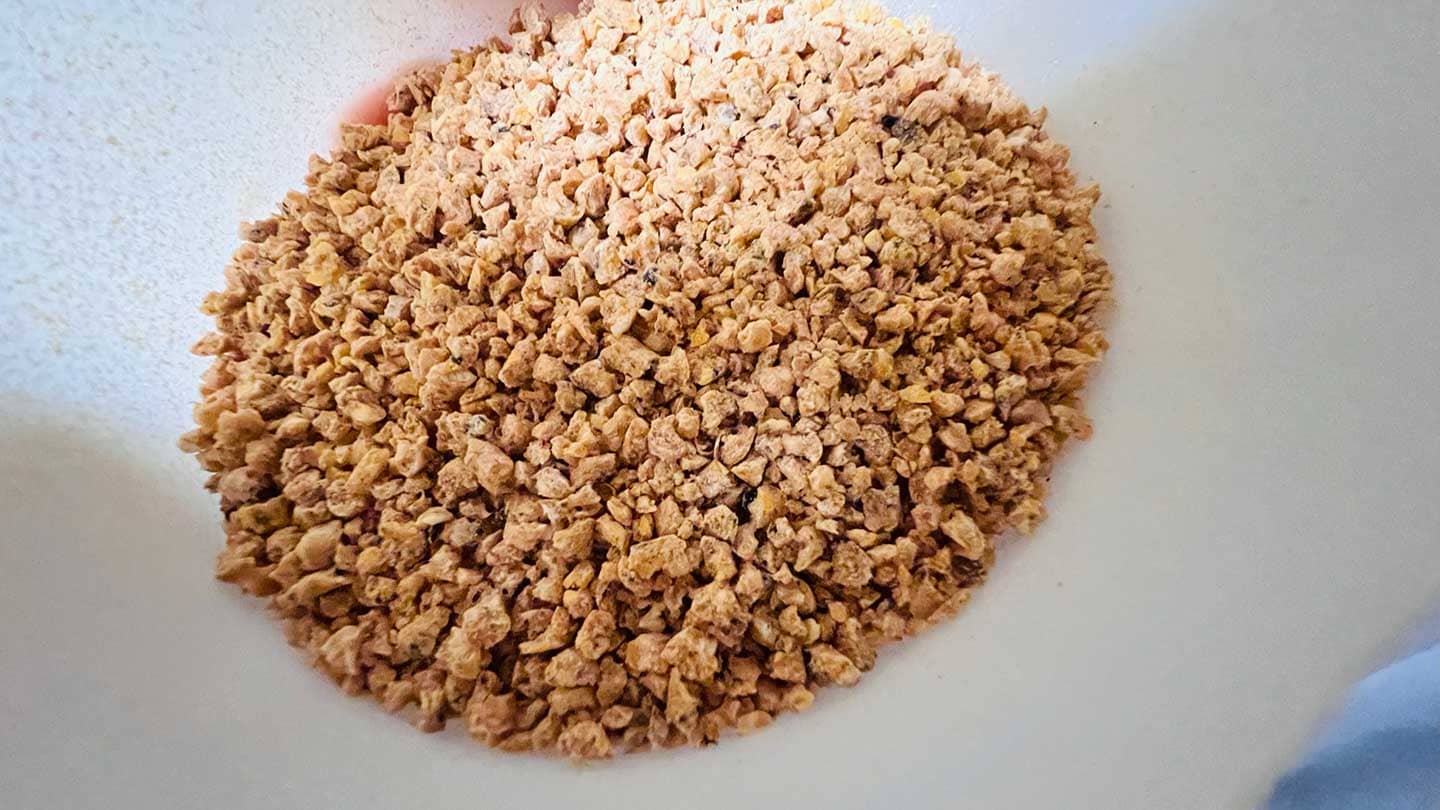
Feed Conversion Ratio (FCR) is a critical metric in livestock production that measures the efficiency with which animals convert feed into body mass. It is expressed as the amount of feed required to produce a unit of meat, milk, or eggs. Advances in nutrition and precision feeding allow producers to tailor diets that optimize FCR, reducing waste and improving nutrient uptake. Also, breeding programs focused on improving FCR can lead to livestock that naturally convert feed more efficiently, supporting long-term sustainability.

Poultry (Broilers): From the 1950s, improved from approximately 4.75 kg/kg to 1.7 kg/kg.

Pigs: From the 1950s, improved from about 4.5 kg/kg to 2.75 kg/kg.

Cattle (Beef): From the 1950s, improved from around 7.5 kg/kg to 6.0 kg/kg.

FCR ChangeFigure 4. Evolution of FCR from 1950

FCR is crucial for livestock sustainability for several reasons, as shown below.

1. Resource efficiency

Feed Costs: Feed is one of the largest operational costs in livestock production. A lower FCR means less feed is needed to produce the same amount of animal product, reducing costs and improving profitability.

Land Use: Efficient feed conversion reduces the demand for land needed to grow feed crops, helping to preserve natural ecosystems and decrease deforestation pressures.

Water Use: Producing less feed per unit of animal product reduces the water needed for crop irrigation, which is crucial in regions facing water scarcity.

2. Environmental impact

Greenhouse Gas Emissions: Livestock production is a significant source of greenhouse gases (GHGs), particularly methane from ruminants and nitrous oxide from manure management. Improved FCR means fewer animals are needed to meet production goals, reducing total emissions.

Nutrient Runoff: Efficient feed use minimizes excess nutrients that can lead to water pollution through runoff and eutrophication of aquatic ecosystems.

3. Animal welfare

Health and Growth: Optimizing FCR often involves improving animal health and growth rates, which can lead to better welfare outcomes. Healthy animals grow more efficiently and are less susceptible to disease.

4. Economic viability

Competitiveness: Lowering FCR improves the economic viability of livestock operations by reducing input costs and increasing competitiveness in the global market.

Food Security: Efficient livestock systems contribute to food security by maximizing the output of animal protein relative to the input of resources.

Improving FCR is essential for achieving sustainability in livestock production. It leads to more efficient resource use, reduced environmental impact, enhanced economic viability, and supports the well-being of animals. As global demand for animal products continues to rise, optimizing FCR will be crucial in balancing production with the need to protect and preserve natural resources.

“The eight warmest years on record since 1961 (and in fact since the beginning of observations in 1880) are all within the eight-year period of 2015–2022. Europe is the region where the temperature change has been the highest in 2022 (and also for most of the 2000–2022 period), with 2.23 °C, followed by Asia (1.75 °C), the Americas (1.05 °C), Africa (1.01 °C) and Oceania (0.8 °C). The average temperature change in the 2010s was 1.25 °C, compared to 0.96 °C in the 2000s.”
FAOSTAT 2023

Livestock emissions

Livestock emissions can be direct (farm-gate) or indirect (land use). Pre- and post-production emissions are considered separately, since they refer to emissions from manufacturing, processing, packaging, transport, retail, household consumption, and waste disposal.

GHG Emissions
Figure 5. Source: FAO

Farm-gate emissions

Global farm-gate emissions (related to the production of crops and livestock) grew by 14% between 2000 and 2021, to 7.8 Gt CO2 eq, see below. 53% come from livestock-related activities, and the emissions from enteric fermentation generated in the digestive system of ruminant livestock were alone responsible for 37 percent of agricultural emissions (FAOSTAT 2023).

World Farm Gate GHG Emissions By Activity
Figure 6. Source: FAO

Land use for livestock

Land use emissions contribute a large share to agricultural emissions overall, especially through deforestation (~74% of land-use GHG emissions). The numbers have declined in recent years, to a total of 21% reduction between 2000 and 2018.

The other side of the coin is represented by the increased land usage for livestock, either directly for grazing or indirectly for feed crops.

1. Pasture and grazing land

1950: Approximately 3.2 billion hectares (7.9 billion acres) were used as permanent pastures.

Present: The area has increased to around 3.5 billion hectares (8.6 billion acres).

Change: An increase of about 0.3 billion hectares (0.7 billion acres).

2. Land for Feed Crops

1950: The land area dedicated to growing feed crops (such as corn and soy) was significantly less than today due to lower livestock production intensities and smaller scale operations. Feed crops likely accounted for about 200-250 million hectares of the cropland, although figures are evidently difficult to estimate.

Present: Of the approx. 5 billion hectares of land globally used for agriculture, about 1.5 billion hectares are dedicated to cropland.

The increase in cropland hectares is a direct consequence of the intensification of demand for livestock production. To keep these numbers in check, it is essential that producers strive to use as little feed as possible for as much meat yield as possible – and this directly relates to a key metric of the feed additive industry: Feed Conversion Ratio, mentioned above.

The role of food loss in livestock sustainability

The Food and Agriculture Organization (FAO) of the United Nations defines food loss as the decrease in quantity or quality of food resulting from decisions and actions by food suppliers in the chain, excluding retail, food service providers, and consumers. Food loss specifically refers to food that gets spilled, spoiled, or lost before it reaches the consumer stage, primarily taking place during production, post-harvest, processing, and distribution stages.

Food loss is currently estimated to be relatively stable over the last decades, at around 13%.

Key aspects of food loss

  1. Stages of Food Loss:
    • Production: Losses that occur during agricultural production, including damage by pests or diseases and inefficiencies in harvesting techniques.
    • Post-Harvest Handling and Storage: Losses that happen due to inadequate storage facilities, poor handling practices, and lack of proper cooling or processing facilities.
    • Processing: Losses during the processing stage, which may include inefficient processing techniques, contamination, or mechanical damage.
    • Distribution: Losses that occur during transportation and distribution due to poor infrastructure, inadequate packaging, and logistical inefficiencies.
  2. Quality and Quantity:
    • Quality Loss: Refers to the reduction in the quality of food, affecting its nutritional value, taste, or safety, which may not necessarily reduce its quantity.
    • Quantity Loss: Refers to the actual reduction in the amount of food available for consumption due to physical losses.
  3. Exclusions:
    • Retail and Consumer Level: Food loss does not include food waste at the retail or consumer levels, which is categorized as food waste. Food waste refers to the discarding of food that is still fit for consumption by retailers or consumers.

Importance of reducing food loss

Every step along the production chain, each action taken to preserve feed, increase yield, ensure stable and high meat quality, can contribute to reducing food loss and ensuring that animal protein production stays sustainable and feeds the world more efficiently.

  • Food Security: Reducing food loss can help improve food availability and access, particularly in regions where food scarcity is a concern. Where we thought we were on our way to eradicate world hunger, recent upticks in several regions show us that progress is not a given.
  • Economic Efficiency: Minimizing food loss can improve the efficiency and profitability of food supply chains by maximizing the utilization of resources.
  • Environmental Impact: Reducing food loss helps to decrease the environmental footprint of food production by lowering greenhouse gas emissions and minimizing land and water use. This is all the more important in regions where world hunger shows signs of going up. Perhaps not by coincidence are these regions some of the most affected by climate change.

By understanding and addressing the causes of food loss, stakeholders across the food supply chain can work towards more sustainable and efficient food systems.

What’s next?

Improving production practices and technology

Investment in research and development of new technologies that enhance livestock production efficiency and reduce environmental impact is vital for the future sustainability of the sector.

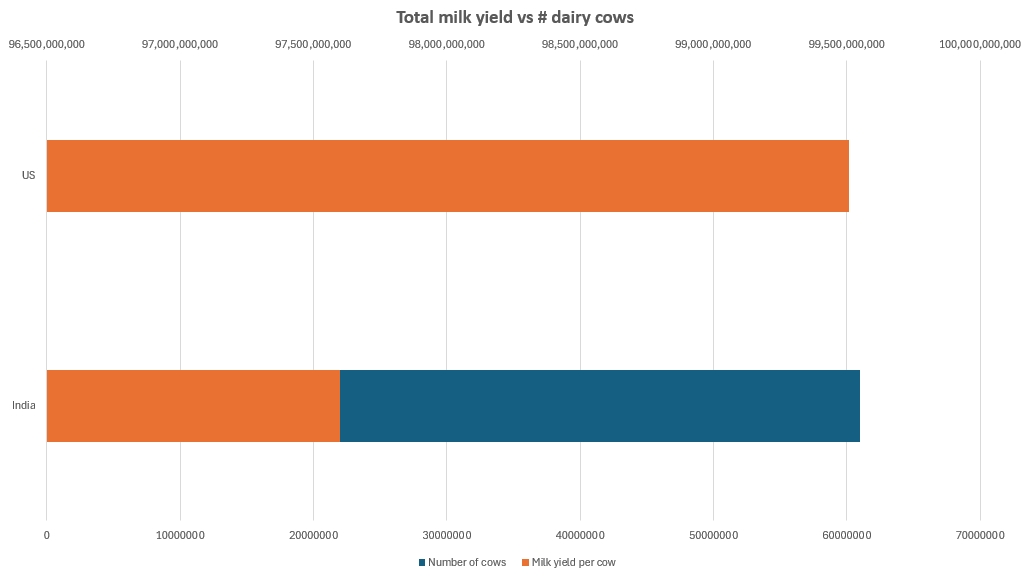
India is a good illustration of room to grow. If we look at cow milk alone, India, with a headcount of approximately 61 million animals, has a total milk production that is neck-and-neck with the United States, whose dairy cow headcount is in the neighborhood of 9.3 million. India’s milk yield sits around 1,600 liters/animal/year, compared to the US’s average of 10,700 liters.

Milk Yield IN US
Figure 7. Based on Our World in Data

Optimizing Feed Efficiency

Continued focus on improving FCR through genetic selection, optimized nutrition, and advanced management practices will be crucial for reducing the environmental footprint of livestock production.

Promoting Sustainable Land Use

Strategies to balance the need for increased livestock production with sustainable land use practices are essential. This includes adopting agroecological approaches and improving the efficiency of feed crop production.

Reducing Food Loss

Stakeholders across the food supply chain must prioritize reducing food loss through improved storage, transportation, and processing technologies. This will help ensure that livestock production contributes effectively to global food security.

Enhancing Emission Tracking and Reporting

There is a need for standardized methods for collecting and reporting data on GHG emissions in agriculture. This will enable more accurate assessments and the development of targeted strategies for emission reductions.

References

Bell, D. D. (2002). Laying hens in the U.S. market: An appraisal of trends from the beginning of the 20th century to present. Poultry Science, 81(5), 485-490. https://doi.org/10.1093/ps/81.5.485

CarbonWise. (2023). Global greenhouse gas emissions by sector. Retrieved from https://carbonwise.co/global-greenhouse-gas-emissions-by-sector/

Crippa, M., Solazzo, E., Guizzardi, D., Monforti-Ferrario, F., Tubiello, F. N., Leip, A., … & Janssens-Maenhout, G. (2022). Greenhouse gas emissions from food systems: building the global food system emissions database (GFED). Earth System Science Data, 14(4), 1795-1821. https://essd.copernicus.org/articles/14/1795/2022/essd-14-1795-2022.pdf

European Environment Agency (EEA). (2023). Improving the climate impact of raw material sourcing. Retrieved from https://www.eea.europa.eu/publications/improving-the-climate-impact-of-raw-material-sourcing

Food and Agriculture Organization of the United Nations (FAO). (2021). The State of Food and Agriculture 2021: Making agrifood systems more resilient to shocks and stresses. FAO. https://openknowledge.fao.org/server/api/core/bitstreams/6e04f2b4-82fc-4740-8cd5-9b66f5335239/content

Food and Agriculture Organization of the United Nations (FAO). (2021). Food Loss and Waste Database. FAO. https://www.fao.org/platform-food-loss-waste/food-loss/introduction/en

Food and Agriculture Organization of the United Nations (FAO). (2021). Greenhouse gas emissions from agrifood systems. Retrieved from https://www.fao.org/platform-food-loss-waste/food-loss/introduction/en

Goldewijk, K. K., & Verburg, P. H. (2013). Per-capita estimations of long-term historical land use and the consequences for global change research. Global Environmental Change, 23(4), 1166-1175. https://doi.org/10.1016/j.gloenvcha.2013.04.001

Intergovernmental Panel on Climate Change (IPCC). (2023). AR6 Synthesis Report: Climate Change 2023. IPCC. https://www.ipcc.ch/report/ar6/syr/

Kusuma, A. B., Laga, W. R., & Purnomo, H. (2022). Climate Change and Livestock Farming: Strategies for Mitigation and Adaptation. MDPI, 12(10), 1554. https://www.mdpi.com/2077-0472/12/10/1554

Matthews, D. (2023). Chicken, meat, and the future of global food: Forecasts and predictions for beef, pork, and more. Vox. https://www.vox.com/future-perfect/2023/8/4/23818952/chicken-meat-forecast-predictions-beef-pork-oecd-fao?mc_cid=d1a37e53b6&mc_eid=1b5c5e908a

Our World in Data. (2020). Milk yields per animal. Retrieved from https://ourworldindata.org/grapher/milk-yields-per-animal

Our World in Data. (2023). Grazing land use over the long-term, 1600 to 2023. Retrieved from https://ourworldindata.org/grazing-land-use-over-the-long-term

Ritchie, H., & Roser, M. (2020). Food greenhouse gas emissions. Our World in Data. https://ourworldindata.org/food-ghg-emissions

Roche, J. R., Friggens, N. C., Kay, J. K., Fisher, M. W., Stafford, K. J., & Berry, D. P. (2013). Invited review: Body condition score and its association with dairy cow productivity, health, and welfare. Animal Frontiers, 3(4), 23-29. https://doi.org/10.2527/af.2013-0032

Sharma, V. P., & Gulati, A. (2020). Changes in Herd Composition a Key to Indian Dairy Production. United States Department of Agriculture (USDA) Economic Research Service. https://www.ers.usda.gov/publications/pub-details/?pubid=99794

The Last Glaciers. (2023). Decarbonizing Food and Agriculture. Retrieved from https://thelastglaciers.com/decarbonising-food-and-agriculture/

Thoma, G., Jolliet, O., & Wang, Y. (2016). National Pork Board. (2016). Greenhouse gas emissions and the potential for mitigation from the pork industry in the U.S. Retrieved from https://www.porkcheckoff.org/wp-content/uploads/2021/05/16-214-THOMA-final-rpt.pdf

Thornton, P. K., & Herrero, M. (2015). Impacts of climate change on the livestock food supply chain; a review of the evidence. Frontiers in Veterinary Science, 2, 93. https://www.ncbi.nlm.nih.gov/pmc/articles/PMC4686767/

USDA – National Agricultural Statistics Service. (n.d.). Trends in U.S. Agriculture – Broiler Industry. U.S. Department of Agriculture. Retrieved from https://www.nass.usda.gov/Publications/Trends_in_U.S._Agriculture/Broiler_Industry/

Zuidhof, M. J., Schneider, B. L., Carney, V. L., Korver, D. R., & Robinson, F. E. (2014). Evolution of the modern broiler and feed efficiency. Annual Review of Animal Biosciences, 2(1), 47-71. https://doi.org/10.1146/annurev-animal-022513-114132


Will weight loss drugs impact the future of agriculture?

By Ilinca Anghelescu, Global Director Marketing Communications, EW Nutrition

Medications like GLP-1 receptor agonists, such as semaglutide (marketed as Ozempic, Wegovy, Zepbound etc.), have demonstrated startling efficacy in reducing body weight and are now at the forefront of obesity treatment. Since they work primarily by suppressing appetite, an obvious question is being considered across the entire food chain: will weight loss drugs significantly impact the future of agriculture?

More and more voices are answering “yes”. Not only are models showing a significant impact of these drugs over the medium- and long term, but the demand reduction triggered by weight loss drugs will hurt regions where population peak and shifting demand are already lowering the growth potential of certain segments of agriculture.

Changes are already seen in food consumption

Weight loss drugs like semaglutide work by mimicking the GLP-1 hormone, which regulates appetite and insulin secretion. By doing so, these medications reduce hunger and caloric intake, leading to weight loss. They also appear to reduce consumption of alcohol, tobacco, and junk food. While they have been around for more than a decade, they only recently started to be prescribed for the express purpose of weight loss. In the meantime, medical research is yielding increasingly better results at more affordable prices and with easier application, which will lead to much more widespread adoption around the world.

Currently, around 1.7% of the US population is officially prescribed such drugs, although it is hard to know how many people are actually taking this type of medication. Morgan Stanley expects the figure to grow to 7% within ten years – equivalent to well over 23 million people in the US alone. Even with this currently small percentage, retailers are claiming to see effects. Pepsi, Nestle and Walmart are among those preparing to pivot in the face of expected losses.

As more individuals adopt these drugs for weight management, dietary patterns are expected to shift even more, impacting food demand at both individual and population levels. With a 25% reduction in caloric intake for a considerable slice of the world’s over 1 billion obese people, not to mention overweight populations that might take these drugs off-label, the math speaks for itself.

Potential implications for agriculture

  1. Crop Production Adjustments: Farmers might adjust crop production to align with changing consumer preferences. Increased demand for fruits, vegetables, and whole grains could lead to a shift in crop priorities, influencing agricultural planning and resource allocation.
  2. Livestock Industry: A potential decrease in demand for high-fat meats and increase in demand for leaner meats could impact the livestock industry, leading to changes in breeding, feeding, and marketing strategies. Animal protein, however, remains much less impacted than industries supplying manufacturers of junk food, alcohol, and tobacco.

Changes in consumer demand will inevitably impact food prices and market dynamics, from the field to retail shelves. Increased demand for healthier food options might lead to industry shifts and higher prices initially, but as production scales up, prices could stabilize. This economic transition will require strategic adjustments across the supply chain.

Bonus problem: World population will peak and decline within two generations

To add insult to injury: United Nations demographic models suggest population growth will peak around 10.3 billion in the mid-2080s, then decline. Naturally, the distribution is unequal across the board, with some countries peaking this year and others growing at staggering speeds.

For instance, 63 countries and areas will already see population peaks in 2024 and are expected to decline by 14% over the next 30 years – including China, Russia, Germany, and Japan.

“Angola, Central African Republic, the Democratic Republic of the Congo, Niger and Somalia are likely to grow exponentially, with populations doubling in size or more between 2024 and 2054. More than one fifth of the projected increase in the global population between 2024 and 2054 is expected to be concentrated in these nine countries. Due to this rapid growth, the ranking of the most populous countries in the world will likely change, with Pakistan and eventually Nigeria and the Democratic Republic of the Congo overtaking the United States of America in terms of population size, and the United Republic of Tanzania likely joining the list of the ten largest countries by the end of the century.”

United Nations World Population Prospects 2024


These new demographic models should already shape the long-term plans not just for companies, but for countries and alliances as well – and agriculture will represent a major point of impact. In its case, this map is consistent with FAO’s analysis of growth areas and lends even more credence to the idea of major shifts already felt within a generation. Growth in protein demand will move to what are now seen as developing nations, while developed countries should expect shrinking demand. It is, however, in these developed countries where obesity drugs will hit first and most strongly, lowering demand that is already nearing its peak.

Obese Population OECD Countries

Still: It’s not all bad news!

The emergence of weight loss drugs like semaglutide has the potential to influence dietary patterns significantly, thereby impacting agricultural demand and production. While this is undeniably a challenge, there is a major opportunity here as well: The industries that will be most severely hit do not include healthy protein production. A reduced food intake will likely require a higher quality of nutrition in general, with reduced demand for “empty” calories and increased demand for vitamin-, fiber-, and especially protein-packed meals, tasty as well as nutritionally rich.


Further reading

Wilding, J.P.H., et al. (2021). “Once-Weekly Semaglutide in Adults with Overweight or Obesity.” *New England Journal of Medicine*, 384(11), 989-1002. https://www.nejm.org/doi/full/10.1056/NEJMoa2032183

Astrup, A., et al. (2021). “Semaglutide for the treatment of overweight and obesity: A review.” *Diabetes, Obesity and Metabolism*, 23(S1), 39-49. https://dom-pubs.onlinelibrary.wiley.com/doi/full/10.1111/dom.14863

Garnett, T. (2011). “Where are the best opportunities for reducing greenhouse gas emissions in the food system (including the food chain)?” *Food Policy*, 36, S23-S32. https://www.sciencedirect.com/science/article/abs/pii/S0306919210001132


Global Trends and Challenges in Artificial Meat and Alternative Protein Production

Over the past decade, the food industry witnessed a surge in the popularity of alternative proteins, driven by growing consumer awareness of environmental issues, animal welfare concerns, and health considerations. However, recent trends indicate a decline in both consumer interest and investment in alternative proteins. This article explores the challenges in producing viable replacements for traditional meat, the status of sales investments, and the global outlook for protein consumption.

Unit Prices By Category


Patty Price Per Country

Figure 1. Uncompetitive prices of artificial meat are a critical factor in the market downturn

Challenges in artificial meat production

Producing artificial meat, also known as cultured or lab-grown meat, has been widely hyped and substantially funded over the last decade. However, many challenges remain on several levels.

Cell Culturing and Growth

Cell Source: Obtaining high-quality animal cells is crucial. Researchers typically use muscle cells (myocytes) from animals like cows, pigs, or chickens.

Cell Proliferation: Culturing cells in the lab requires precise conditions, including the right nutrients, temperature, and oxygen levels. Ensuring rapid and efficient cell growth is essential.

Scaffold Development

3D Structure: Creating a meat-like texture involves growing cells on a scaffold that mimics the natural 3D structure of muscle tissue. Developing suitable scaffolds is challenging.

Biocompatibility: The scaffold material must be biocompatible and support cell attachment, proliferation, and differentiation.

Nutrient Supply

Medium Formulation: The nutrient-rich medium used to feed the cells must provide essential amino acids, vitamins, and minerals. Designing an optimal medium is complex.

Cost Efficiency: Developing cost-effective and sustainable nutrient solutions is critical for large-scale production.

Scaling Up Production

Bioreactors: Moving from small-scale lab experiments to large-scale bioreactors is a significant challenge. Bioreactors must maintain consistent conditions for cell growth.

Energy Consumption: Scaling up production while minimizing energy consumption and environmental impact is essential.

Flavor and Texture

Taste and Aroma: Artificial meat would be expected to taste and smell like traditional meat. Achieving the right flavor profile is an ongoing challenge.

Texture: Mimicking the texture of different meat cuts (e.g., steak, ground beef) requires precise engineering.

Safety and Regulation

Food Safety: Ensuring that cultured meat is safe for consumption is critical. Contamination risks, such as bacterial growth, must be minimized.

Regulatory Approval: Cultured meat faces regulatory hurdles related to labeling, safety assessments, and consumer acceptance.

Cost Reduction

High Initial Costs: Currently, producing artificial meat is expensive due to research, development, and infrastructure costs. Reducing these costs is essential for commercial viability.

Acceptance and Perception

Consumer Perception: Convincing consumers that cultured meat is a viable and ethical alternative to traditional meat remains a challenge.

Cultural and Social Factors: Cultural preferences and traditions play a role in consumer acceptance.

Challenges in alternative protein production

As opposed to artificial meat, which still involves animal cells, alternative proteins usually designate plant-based meat imitations. However, producing alternative proteins comes with its own set of challenges.

Diverse protein sources are one challenge that is not easy to overcome. It turns out, it is quite hard to replicate the availability, as well as the diversity of health and nutritional benefits of traditional meat. While plant-based proteins have made significant progress, there’s still room for improvement in terms of variety and availability.

Procuring the technology needed to extract protein efficiently and sustainably is another hurdle. Innovations in extraction methods are essential for scaling up alternative protein production.

Lower nutritional benefits of alternative proteins represent a major hurdle. Not only is it hard to mimic the entirety of meat’s benefits, but plant nutritional values are notoriously fickle depending on region, soil, production type, season, and so on.

Flavor and texture remain extremely elusive. Contenders are closer to a meat-feel than before, yet this remains a major factor skewing negative in consumer perception.

SteakFigure 2: Alternative protein producers have been unable to replicate the taste and texture of traditional meat

Scaling and Supply Chain Challenges are getting more, not less complicated. Achieving affordability at scale is essential for alternative meats to compete with traditional meat products. Additionally, ensuring a robust and efficient supply chain for alternative proteins is a concern that has not found a sustainable solution.

The Status of Alternative Protein Sales and Investment

Sales Trends

According to the Plant Based Foods Association (PBFA), overall plant-based meat units have declined by 8.2% in 2022, while dollar sales decreased by 1.2% following a significant growth phase in previous years. Similarly, Euromonitor International reported that global sales of plant-based meat substitutes grew by only 1% in 2022, a stark contrast to the double-digit growth rates seen earlier in the decade.

Beyond Meat, one of the market leaders, reported a decline in net revenues of 13.9% in the third quarter of 2022 compared to the same period in 2021. This decline reflects broader market trends where consumer enthusiasm appears to be waning.

RabobankFigure 3. Rabobank indicates a downward trend in both sales and investments

Investment Trends

Investment in alternative protein startups also shows signs of slowing, with funding of sustainability food and agriculture startups dramatically declining (see Figure 2 below). According to the Good Food Institute (GFI), global investment in alternative proteins dropped 42% year-over-year to $1.2 billion in 2022, a significant decrease from the $3.1 billion invested in 2021.

The financial challenges faced by some high-profile companies have led to increased caution among investors. For instance, Beyond Meat and Oatly have both experienced substantial stock price declines, leading to a reassessment of the market’s growth potential.

Investment TrendsFigure 4: 2023 funding variation for climate and sustainability technologies

Factors Contributing to the Decline

Market Saturation and Competition

The initial surge in demand led to rapid market saturation. Numerous companies entered the market, resulting in intense competition and a proliferation of products. This saturation has made it difficult for individual brands to maintain market share and grow sales.

In the US, for example, plant-based milk remains the largest category, while plant-based meat and seafood sales declined substantially in 2023.

Consumer Preferences and Expectations

While early adopters of alternative proteins were driven by ethical and environmental considerations, mainstream consumers remain price-sensitive and often prefer traditional meat products (to the extent they may choose smaller meat portions over alternative proteins). Additionally, taste and texture remain critical factors. Despite advancements, many consumers still find plant-based alternatives lacking in these areas.

Not MeatFigure 5: Seems fake? Consumers find it hard to believe the claims of identical taste and texture in non-meat products

Economic Factors

The global economic downturn and inflation have impacted consumer spending power. As a result, many consumers are prioritizing affordability over sustainability, leading to reduced purchases of typically more expensive plant-based products.

Regulatory and Supply Chain Challenges

Regulatory hurdles and supply chain disruptions have also played a role. The COVID-19 pandemic exacerbated supply chain issues, affecting the availability and cost of raw materials needed for alternative protein production.

Conclusion: Global Outlook for Protein and Alternative Proteins

Traditional meat consumption continues to grow, particularly in emerging markets. According to the Food and Agriculture Organization (FAO), global meat consumption is projected to increase by 14% by 2030, driven by population growth and rising incomes in developing countries.

Advances in food technology, such as precision fermentation and cell-cultured meat, offer the potential to create products that more closely mimic traditional meat. However, the recent decline in interest in alternative proteins reflects a complex interplay of market saturation, economic factors, and consumer preferences.

High prices, lack of scalability, sustainability concerns, and an inability to recreate the nutritional content, texture, and taste of meat are hurdles that cannot be easily overcome. Instead, perhaps a more accessible long-term solution might be improved sustainability in the livestock sector, accompanied by continued innovation and improvements in the production of both traditional protein and alternative proteins.


Gustavo Tesolin appointed Regional Director of EW Nutrition LATAM

headervisual ewn

Gustavo Tesolin
Gustavo Tesolin

29 January 2024, Visbek – German-based company EW Nutrition, a global provider of functional animal nutrition solutions, has appointed Gustavo Carlos Tesolin as its Regional Director for Latin America.

An agricultural engineer by training, Gustavo Tesolin has forged an international career in the Animal Health business during the last 25 years. With different leadership roles in several major international organizations such as Novartis, Elanco, and Erber Group, Mr. Tesolin brings along important experience in Commercial Operations, P&L drive, and Strategy execution, with special emphasis on team development and geographic expansion.

“I am really excited to join a company as innovation-driven and science-focused as EW Nutrition,” Tesolin said. “The recent launch of VENTAR D, a novel phytogenic specifically designed and developed to improve animal husbandry results, will continue to strengthen our position in the region, together with our winning brands PRETECT D and ACTIVO” and added, “I am eager to take on the challenge and better acquaint the market with an excellent portfolio centered on Gut Health Management, Digestibility, and Feed Quality.”

Jan Vanbrabant, CEO of EW Nutrition, noted that Gustavo Tesolin is “the perfect combination of the right experience and the right attitude. We are happy to have found in him a proven leader with not just excellent market knowledge, but with the same values we share in EW Nutrition: a passion for innovation in the service of our customers, and relentless curiosity and energy to find the right solution.”

This appointment comes on the heels of several top-tier global hires over the last 18 months and reflects the company’s commitment to the Latin American market.

Tesolin will move to Mexico to coordinate EW Nutrition’s expansion in Latin American countries.


About EW Nutrition

EW Nutrition is a German-based international animal nutrition company that offers comprehensive solutions for animal gut health, toxin risk management, growth performance, and more.


Press contact

marketing@ew-nutrition.com


INFOGRAPHIC – Target measurements for water quality

Water is a main nutrient and carrier for vaccines, medicine – including antibiotics, but also for pathogens

Chemistry

Ph Icon
pH and pKa

Acidity and dissociation index
Target: pH 3,5-3,8 Important for acids application (E.g. organic acids, etc), and ORP

Ch
Hardness

Content of Ca, sometimes plus Mg
Target: better TDS Important for acid binding capacity (ABC, buffer capacity)

Ch
Oxidation Reduction Potential (ORP)

Target: 650 mV>700 mV » reduces water intake Important for biocides application (E.g. chlorination)

Ch
Total Dissolved Solids (TDS)

Sum of dissolved salts, minerals, metals, carbonates, organics Target: 2000 ppm>3000 ppm » laxation Important for buffer capacity and ORP

Microbiology

Micro
Yeast

Target: < 5000 cfu/gr

Micro
Enterobacterias

Target: < 100 cfu/gr

Micro
Moulds

Target: < 100 cfu/gr


FEFAC: Quick Overview of 2023 EU Compound Feed Production

Total Production 2023: 144.3 million metric tons for farmed animals

Change from 2022: 2% decrease

Factors Influencing Decrease

Political and Market Pressures: Addressing crises and the shift towards sustainable feed.

Climate and Diseases: Effects of droughts, floods, Avian Influenza (AI), and African Swine Fever (ASF) on raw material supply and animal production.

National Policies: Initiatives for greenhouse gas and nitrate emission reduction.

Consumer Trends: Food price inflation impacting demand.

Production Variability: Different trends across EU Member States, with notable decreases in countries like Germany, Ireland, Denmark, and Hungary, and slight increases in Austria, Bulgaria, Italy, and Romania.

Sector-Specific Trends

By Species
By Species

Pig Feed: Major decline of nearly 2.5 million tons. Key challenges included:

  • Loss of export markets, particularly in Asia
  • Negative media impact in Germany
  • Significant production drop in Denmark (-13.6%) and Spain (loss of 800,000 metric tons)
  • Italy’s ongoing struggle with ASF

Poultry Feed: Increase by 0.9 million tons, yet still 700,000 metric tons below 2021 levels. Challenges included declines in Hungary and Czechia due to reduced broiler production.

Cattle Feed: Decrease of 0.8 million tons from 2022.

2024 key factors

  • Animal disease
  • Economic instability, persistent food price inflation
  • Weather irregularities
  • Continued imports of poultry meat from Ukraine
  • “Green and animal welfare” policies affecting local production

Summary

The EU’s compound feed production in 2023 faced numerous challenges, leading to an overall decrease. The pig feed sector was most severely hit, while poultry feed showed some recovery. The influence of environmental, economic, and policy factors played a significant role in shaping these trends. Despite the price of feed cereals falling back to the levels seen before Russia’s invasion of Ukraine, these challenges will continue to be felt in 2024.


Source: FEFAC


Meat labels explained

Certified Organic: (US, others) To be labeled as “Certified Organic” in the US, meat and poultry must come from animals that are raised in accordance with organic farming standards. These standards typically include restrictions on the use of synthetic pesticides, herbicides, antibiotics, and genetically modified organisms (GMOs). The animals are typically raised with organic feed and have access to the outdoors.

Chemical-free: (US) A product that contains no artificial ingredients or chemical preservatives.

Free-range or Free-roaming: (International) Poultry that has been allowed access to the outside.

Free-Range or Pasture-Raised: (US, others) These terms suggest that the animals had access to the outdoors or were raised on pasture, which can offer better living conditions than confined, industrial operations.

Fresh poultry: (US) Poultry that has never been below 26°F.

Frozen poultry: (US) Poultry that has been held at 0°F or lower.

Grain-Fed: (International) This label implies that the animals were primarily fed grains or other non-grass-based diets, which is common in many commercial meat production systems.

Grass-Fed: (International) “Grass-Fed” typically means that the animals were primarily fed a diet of grass or forage throughout their lives, although some supplemental grains may be allowed. This label does not necessarily imply organic or non-GMO practices.

Halal: (International) Halal meat is prepared following Islamic dietary laws. This includes specific slaughter methods and requirements for the handling and preparation of the meat.

Kosher: (International) Kosher meat is prepared according to Jewish dietary laws and involves specific slaughtering practices and inspections.

Mechanically separated meat: (US) A paste-like meat product produced by forcing bones, with attached edible meat, under high pressure through a sieve or similar device to separate the bone from the edible meat tissue.

Natural: (US) A product containing no artificial ingredient or added color and is only minimally processed (a process which does not fundamentally alter the raw product). The label must explain the use of the term natural (such as “no added colorings or artificial ingredients; minimally processed”).

No antibiotics: (US) The terms “no antibiotics added” may be used on labels for meat or poultry products if sufficient documentation is provided by the producer to the USDA demonstrating that the animals were raised without antibiotics. If an animal becomes sick and requires antibiotics, it cannot be sold as “no antibiotics added.”

No hormones (beef): (US) The term “no hormones administered” may be approved for use on the label of beef products if sufficient documentation is provided to USDA by the producer showing no hormones have been used in raising the animals.

No hormones (pork or poultry): (US) Federal regulations prohibit the use of hormones in raising hogs and poultry.

Non-GMO: (International) A “Non-GMO” label indicates that the animals were not fed genetically modified organisms. This label may apply to both feed and the animals themselves.

Organic: (International) Meat and poultry labeled as organic must come from animals fed organic – which also means non-GMO – feed, given fresh air and outdoor access, and raised without antibiotics or added growth hormones. Organic livestock must also have access to pasture for at least 120 days per year.

Protected Designation of Origin (PDO) and Protected Geographical Indication (PGI): (EU) These labels are used to protect and promote regional and traditional foods. Meat labeled with PDO and PGI must come from specific regions and meet particular quality and production standards.

Raised without Antibiotics or Antibiotic-Free: (International) This label indicates that the animals were not treated with antibiotics during their lifetime. However, this label does not necessarily mean the animals were raised in organic or free-range conditions.

Sustainably Sourced: (International) This label may indicate that the meat was produced with a focus on environmental and ethical considerations, such as minimizing ecological impact and promoting fair labor practices.


No revision of the Feed Additives law, says the European Commission

The authorization and marketing of feed additives in the European Union is currently governed by Feed Additives Regulation (EC) No 1831/2003, which came into effect in 2004. In 2021, the European Commission formalized an initiative to revise it, stating as reasons both the focus brought by the Farm to Fork Strategy, as well as inherent complexities in phrasing, process, and more. Representatives of the EC’s responsible unit, DG SANTE Unit G5, have now confirmed to EW Nutrition that, following consultations and analysis, the revision of the legislation on the authorisation of feed additives will not happen under the current Commission’s mandate.

The revision was initially deemed necessary on several grounds:

  • Not enough focus on sustainable animal farming
  • Lack of flexibility in promoting technical and scientific innovation
  • A lengthy authorization process
  • Unnecessary administrative burden
  • Ineffective imports control leading to unfair competition between EU and non-EU operators
  • Dependency on imports from third countries for some additives (e.g., vitamins)
  • Restrictions on the circulation of feed additives only intended for export
  • Insufficient legal clarity and consistency for a few aspects of the Regulation, e.g. use of certain additives in drinking water or labelling provisions for worker safety provisions in various complementary but unclear Regulations
  • Extensive, unnecessary labeling regulations that create physical and administrative burdens


Near the end of the two-year assessment process, however, the response of European governmental, supra-national, and non-governmental bodies appears to have been lukewarm. Overall, the conclusion of the EC unit overseeing the process was that “while a review of the framework would be useful, it does not appear necessary, considering the possibilities already granted by the existing legal framework.” In other words, applicants will have to use the existing mechanisms for applications, with no prospect for change in the near future.

Other strategies and regulations have also fallen through the cracks. For instance, the EU Animal Health Strategy 2007-2013 has not been updated in 10 years and there are no plans to renew the initiative. This is likely because the Green Deal and the flurry of new or upcoming regulations related to it are expected to supplant the framework for protein production in the European Union.

As the mandate of the current EC ends in 2024, there is a slim chance that the feed additive authorization process might be made less cumbersome once a new commission takes over.


Minimizing Collateral Effects of Antibiotic Administration in Swine Farms: A Balancing Act

By Dr Merideth Parke BVSc, Regional Technical Manager Swine, EW Nutrition

We care for our animals, and antibiotics are a crucial component in the management of disease due to susceptible pathogens, supporting animal health and welfare.  However, the administration of antibiotics in pig farming has become a common practice to prevent bacterial infections, reduce economic losses, and increase productivity.

All antibiotic applications have collateral consequences of significance, bringing a deeper consideration to their non-essential application. This article aims to challenge the choice to administer antibiotics by exploring the broader impact that antibiotics have on animal and human health, economies, and the environment.

Antibiotics disrupt microbial communities

Antibiotics do not specifically target pathogenic bacteria. By impacting beneficial microorganisms, they disrupt the natural balance of microbial communities within animals. They reduce the microbiota diversity and abundance of all susceptible bacteria – beneficial and pathogenic ones… many of which play crucial roles in digestion, brain function, the immune system, and respiratory and overall health. Resulting microbiota imbalances may present themselves in animals showing health performance changes associated with non-target systems, including the nasal, respiratory, or gut microbiome10, 9, 16. The gut-respiratory microbiome axis is well-established in mammals. Gut microbiota health, diversity, and nutrient supply directly impact respiratory health and function15. In pigs specifically, the modulation of the gut microbiome is being considered as an additional tool in the control of respiratory diseases such as PRRS due to the link between the digestion of nutrients, systemic immunity, and response to pulmonary infections12.

The collateral effect of antibiotic administration disrupting not only the microbial communities throughout the animal but also linked body systems needs to be considered significant in the context of optimal animal health, welfare, and productivity.

Antibiotic use can lead to the release of toxins

The consideration of the pathogenesis of individual bacteria is critical to mitigate potential for direct collateral effects associated with antibiotic administration. For example, in cases of toxin producing bacteria, when animals are medicated either orally or parenterally, mortality may increase due to the associated release of toxins when large numbers of toxin producing bacteria are killed quickly3.

Modulation of the brain function can be critical

Numerous animal studies have investigated the modulatory role of intestinal microbes on the gut-brain axis. One identified mechanism seen with antibiotic-induced changes in fecal microbiota is the decreased concentrations of hypothalamic neurotransmitter precursors, 5-hydroxytryptamine (serotonin), and dopamine6. Neurotransmitters are essential for communication between the nerve cells. Animals with oral antibiotic-induced microbiota depletion have been shown to experience changes in brain function, such as spatial memory deficits and depressive-like behaviors.

Processing of waste materials can be impacted

Anaerobic treatment technology is well accepted as a feasible management process for swine farm wastewater due to its relatively low cost with the benefit of bioenergy production. Additionally, the much smaller volume of sludge remaining after anaerobic processing further eases the safe disposal and decreases the risk associated with the disposal of swine waste containing residual antibiotics5.

The excretion of antibiotics in animal waste, and the resulting presence of antibiotics in wastewater, can impact the success of anaerobic treatment technologies, which already could be demonstrated by several studies8, 13. The degree to which antibiotics affect this process will vary by type, combination, and concentration. Furthermore, the presence of antibiotics within the anaerobic system may result in a population shift towards less sensitive microbes or the development of strains with antibiotic-resistant genes1, 14.

Antibiotics can be transferred to the human food chain

Regulatory authorities specify detailed withdrawal periods after antibiotic treatment. However, residues of antibiotics and their metabolites may persist in animal tissues, such as meat and milk, even after this period. These residues can enter the human food chain if not adequately monitored and controlled.

Prolonged exposure to low levels of antibiotics through the consumption of animal products may contribute to the emergence of antibiotic-resistant bacteria in humans, posing a significant public health risk.

Contamination of the environment

As already mentioned before, the administration of antibiotics to livestock can result in the release of these compounds into the environment. Antibiotics can enter the soil, waterways, and surrounding ecosystems through excretions from treated animals, inappropriate disposal of manure, and runoff from agricultural fields. Once in the environment, antibiotics can contribute to the selection and spread of antibiotic-resistant bacteria in natural bacterial communities. This contamination poses a potential risk to wildlife, including birds, fish, and other aquatic organisms, as well as the broader ecological balance of affected ecosystems.

Every use of antibiotics can create resistance

One of the widely researched concerns associated with antibiotic use in livestock is the development of antibiotic resistance. The development of AMR does not require prolonged antibiotic use and, along with other collateral effects, also occurs when antibiotics are used within recommended therapeutic or preventive applications.

Gene mutations can supply bacteria with abilities that make them resistant to certain antibiotics (e.g., a mechanism to destroy or discharge the antibiotic). This resistance can be transferred to other microorganisms, as seen with the effect of carbadox on Escherichia coli7 and Salmonella enterica2 and the carbadox and metronidazole effect on Brachyspira hyodysenteriae16. Additionally, there is an indication that the zinc resistance of Staphylococcus of animal origin is associated with the methicillin resistance coming from humans4.

Consequently, the effectiveness of antibiotics in treating infections in target animals becomes compromised, and the risk of exposure to resistant pathogens for in-contact animals and across species increases, including humans.

Alternative solutions are available

To successfully minimize the collateral effects of antibiotic administration in livestock, a unified strategy with support from all stakeholders in the production system is essential. The European Innovation Partnership – Agriculture11 concisely summarizes such a process as requiring…

  1. Changing human mindsets and habits: this is the first and defining step to successful antimicrobial reduction
  2. Improving pig health and welfare: Prevention of disease with optimal husbandry, hygiene, biosecurity, vaccination programs, and nutritional support.
  3. Effective antibiotic alternatives: for this purpose, phytomolecules, pro/pre-biotics, organic acids, and immunoglobulins are considerations.

In general, implementing responsible antibiotic stewardship practices is paramount. This includes limiting antibiotic use to the treatment of diagnosed infections with an effective antibiotic, and eliminating their use as growth promotors or for prophylactic purposes.

Keeping the balance is of crucial importance

While antibiotics play a crucial role in ensuring the health and welfare of livestock, their extensive administration in the agricultural industry has collateral effects that cannot be ignored. The development of antibiotic resistance, environmental contamination, disruption of microbial communities, and the potential transfer of antibiotic residues to food pose significant challenges.

Adopting responsible antibiotic stewardship practices, including veterinary oversight, disease prevention programs, optimal animal husbandry practices, and alternatives to antibiotics, can strike a balance between animal health, efficient productive performance, and environmental and human health concerns.

The collaboration of stakeholders, including farmers, veterinarians, policymakers, industry and consumers, is essential in implementing and supporting these measures to create a sustainable and resilient livestock industry.

References

  1. Angenent, Largus T., Margit Mau, Usha George, James A. Zahn, and Lutgarde Raskin. “Effect of the Presence of the Antimicrobial Tylosin in Swine Waste on Anaerobic Treatment.” Water Research 42, no. 10–11 (2008): 2377–84. https://doi.org/10.1016/j.watres.2008.01.005.
  2. Bearson, Bradley L., Heather K. Allen, Brian W. Brunelle, In Soo Lee, Sherwood R. Casjens, and Thaddeus B. Stanton. “The Agricultural Antibiotic Carbadox Induces Phage-Mediated Gene Transfer in Salmonella.” Frontiers in Microbiology 5 (2014). https://doi.org/10.3389/fmicb.2014.00052.
  3. Castillofollow, Manuel Toledo, Rocío García Espejofollow, Alejandro Martínez Molinafollow, María Elena  Goyena Salgadofollow, José Manuel Pintofollow, Ángela Gallardo Marínfollow, M. Toledo, et al. “Clinical Case: Edema Disease – the More I Medicate, the More Pigs Die!” $this->url_servidor, October 15, 2021. https://www.pig333.com/articles/edema-disease-the-more-i-medicate-the-more-pigs-die_17660/.
  4. Cavaco, Lina M., Henrik Hasman, Frank M. Aarestrup, Members of MRSA-CG:, Jaap A. Wagenaar, Haitske Graveland, Kees Veldman, et al. “Zinc Resistance of Staphylococcus Aureus of Animal Origin Is Strongly Associated with Methicillin Resistance.” Veterinary Microbiology 150, no. 3–4 (2011): 344–48. https://doi.org/10.1016/j.vetmic.2011.02.014.
  5. Cheng, D.L., H.H. Ngo, W.S. Guo, S.W. Chang, D.D. Nguyen, S. Mathava Kumar, B. Du, Q. Wei, and D. Wei. “Problematic Effects of Antibiotics on Anaerobic Treatment of Swine Wastewater.” Bioresource Technology 263 (2018): 642–53. https://doi.org/10.1016/j.biortech.2018.05.010.
  6. Köhler, Bernd, Helge Karch, and Herbert Schmidt. “Antibacterials That Are Used as Growth Promoters in Animal Husbandry Can Affect the Release of Shiga-Toxin-2-Converting Bacteriophages and Shiga Toxin 2 from Escherichia Coli Strains.” Microbiology 146, no. 5 (2000): 1085–90. https://doi.org/10.1099/00221287-146-5-1085.
  7. Loftin, Keith A., Cynthia Henny, Craig D. Adams, Rao Surampali, and Melanie R. Mormile. “Inhibition of Microbial Metabolism in Anaerobic Lagoons by Selected Sulfonamides, Tetracyclines, Lincomycin, and Tylosin Tartrate.” Environmental Toxicology and Chemistry 24, no. 4 (2005): 782–88. https://doi.org/10.1897/04-093r.1.
  8. Looft, Torey, Heather K Allen, Brandi L Cantarel, Uri Y Levine, Darrell O Bayles, David P Alt, Bernard Henrissat, and Thaddeus B Stanton. “Bacteria, Phages and Pigs: The Effects of in-Feed Antibiotics on the Microbiome at Different Gut Locations.” The ISME Journal 8, no. 8 (2014a): 1566–76. https://doi.org/10.1038/ismej.2014.12.
  9. Looft, Torey, Heather K. Allen, Thomas A. Casey, David P. Alt, and Thaddeus B. Stanton. “Carbadox Has Both Temporary and Lasting Effects on the Swine Gut Microbiota.” Frontiers in Microbiology 5 (2014b). https://doi.org/10.3389/fmicb.2014.00276.
  10. Nasralla, Meisoon. “EIP-Agri Concept.” EIP-AGRI – European Commission, September 11, 2017. https://ec.europa.eu/eip/agriculture/en/eip-agri-concept.html.
  11. Niederwerder, Megan C. “Role of the Microbiome in Swine Respiratory Disease.” Veterinary Microbiology 209 (2017): 97–106. https://doi.org/10.1016/j.vetmic.2017.02.017.
  12. Poels, J., P. Van Assche, and W. Verstraete. “Effects of Disinfectants and Antibiotics on the Anaerobic Digestion of Piggery Waste.” Agricultural Wastes 9, no. 4 (1984): 239–47. https://doi.org/10.1016/0141-4607(84)90083-0.
  13. Shimada, Toshio, Julie L. Zilles, Eberhard Morgenroth, and Lutgarde Raskin. “Inhibitory Effects of the Macrolide Antimicrobial Tylosin on Anaerobic Treatment.” Biotechnology and Bioengineering 101, no. 1 (2008): 73–82. https://doi.org/10.1002/bit.21864.
  14. Sikder, Md. Al, Ridwan B. Rashid, Tufael Ahmed, Ismail Sebina, Daniel R. Howard, Md. Ashik Ullah, Muhammed Mahfuzur Rahman, et al. “Maternal Diet Modulates the Infant Microbiome and Intestinal Flt3l Necessary for Dendritic Cell Development and Immunity to Respiratory Infection.” Immunity 56, no. 5 (May 9, 2023): 1098–1114. https://doi.org/10.1016/j.immuni.2023.03.002.
  15. Slifierz, Mackenzie Jonathan. “The Effects of Zinc Therapy on the Co-Selection of Methicillin-Resistance in Livestock-Associated Staphylococcus Aureus and the Bacterial Ecology of the Porcine Microbiota,” 2016.
  16. Stanton, Thaddeus B., Samuel B. Humphrey, Vijay K. Sharma, and Richard L. Zuerner. “Collateral Effects of Antibiotics: Carbadox and Metronidazole Induce VSH-1 and Facilitate Gene Transfer among Brachyspira HyodysenteriaeApplied and Environmental Microbiology 74, no. 10 (2008): 2950–56. https://doi.org/10.1128/aem.00189-08.


Layer production losses: causes, types, solutions

By Dr. Sandeep Dwivedi, MVSc., Astt. Manager Technical Services, EW Nutrition India

Consumer demand drives egg production. With 10 billion people on the planet by the year 2050 (1), producers are under more pressure to provide more protein of higher quality. Modern production practices help extend the laying cycle of commercial flocks to 90–100 weeks. The volume of eggs produced worldwide has thus increased by more than 100% since 1990. Consumers are pushing not just for more eggs, but also for larger eggs. Due to these shifting requirements, farmers and integrators are under pressure to meet demand. As a result, the birds are under metabolic stress to meet needs, which can compromise eggshell quality, laying consistency, and gut health.

Gut health is a key factor in achieving maximum productive potential and laying rate, not only because it’s a key factor for digestion and the absorption of nutrients but also because it’s an essential component of the bird’s immune system.

In today’s layer production, when the cycle is increasing and overall demand to limit the use of antibiotics is growing, laying persistency, eggshell quality, and gut health are critical topics. But what does a laying hen’s healthy gut mean?

Birds need a healthy gut to maximize production. Genetics, nutrition, management and biosecurity all affect production parameters. A gut with a diverse pH and healthy microbiota prevents infections. Gut health is affected by Goblet cells, paneth cells, endocrine cells, absorptive enterocytes, tight junctions, GALT, and mucus. To deal with potential challenges and ensure optimal bird performance, a complex approach is needed, consisting of optimal carbohydrates, proteins, amino acids, minerals, vitamins, enzymes, organic acids, and management strategies.

Vital amino acids, Zn, Vit E, Se, etc. must be supplemented according to the production status and environment to establish good immunity. Maximum production requires a stress-free, hormonally balanced, clean environment, as well as optimal nutrition. Especially given the push for reduced antibiotics and rising welfare and food standards, particularly from the expansion in cage-free farming, producers need to pay considerable attention to the issues of maintaining a healthy gut with these added challenges. Several aspects must be considered when it comes to gut health.

Factors affecting layer gut health

  • Breed
  • Management
  • Environment
  • Diet – Nutrients and Anti-Nutritional Factors (ANFs)
  • Feed management
  • Stress
  • Toxins (Mycotoxins and endotoxins)
  • Pathogens
  • Microbiota
  • Parasites
  • Physiology
    • Metabolism
    • Immunity
    • Endocrine system

Feed and water are essential

Both vectors create a connection between the external and internal environment of the hen, increasing the possibility of a negative effect on the intestinal balance.

Some common influences:

  • Anti-nutritional factors (non starch polysaccharides and anti-trypsic factors)
  • Water, raw material and feed contaminants (E. Coli, Salmonella, mycotoxins (Fig. 1) etc.)
  • Sudden changes in formulation
  • High density diets – excess of nutrients
  • Bird physiology. How, different organs and the endocrine system respond against challenges
  • Gut microbiota. Represented by the balance between pathogenic and commensal flora. Latter being the one involved in the development of intestinal morphology and structure, immune modulation and supporting digestion and absorption processes.

Effects Of DietaryFig. 1: Effects of dietary mycotoxins on histopathology of the duodenum, jejunum, and ileum Adapted from Zhao et al., 2021 (3)

Layer gut health: An increasing concern

Nowadays the gut health of the layer matters more than ever. In many countries, consumer preferences have been shifting towards eggs produced in non-cage environments and, in these new housing systems, birds are in closer contact with the litter and are more prone to the proliferation of gut pathogens.

Traditionally, layers were housed in cages, which benefited egg producers by making better use of available space and increasing productivity. This resulted in more birds per house, more automated operations, better management, improved hygiene, decreased incidence of infectious diseases, and cheaper feed consumption and production costs.

Cages, on the other hand, pose other health and welfare concerns. They limit or prevent mobility, ground scratching, wing-flapping, and soaring. As a result, there is increasing pressure for birds to be cage-free and, eventually, free-range. The European Commission stated that, by the end of 2023, a legislative proposal will phase out, and eventually prohibit, the use of cages for a variety of farm animals, resulting in an increase in the number of layers reared in a cage-free system.

According to the Egg Track Report (2021), 219 egg farmers, retailers, food service firms, and hotel chains have pledged to transition completely to cage-free eggs by 2025, with 47 of these companies expanding their commitments to encompass their global supply. This means that farmers and integrators will face increased pressure to migrate from a cage system to a cage-free system. As a result, it is necessary to consider new issues or challenges that may be exacerbated by transitioning to a cage-free production system.

Gut health-associated production losses in laying hens

Water (70%), proteins (10%), and lipids (20%) make up egg yolks. The yolk lipids are triglyceride-rich lipoproteins that are produced in the liver and transferred to the ovary. Cholesterol transported to the egg yolk by lipoproteins is also deposited there, demonstrating the importance of the liver in egg formation.

The gut plays an important role in preventing liver damage by acting as a barrier against dangerous viruses and toxins that could enter the bloodstream and reach this key organ. Efficient feed digestion and absorption of nutrients are essential for the hen to obtain the “material” for maintenance, growth, and egg production.

The Association of Veterinarians of Egg Production in the US found in 2014 that gastrointestinal difficulties cause 40% of health issues during the pullet phase and 50% during production. Coccidiosis, necrotic enteritis, and feed passage were the biggest threats from these gastrointestinal illnesses.

Aging reduces digestive health, causing nutrient digestion and absorption problems and immunological issues.  As a result, eggs produced by older hens show increased micro-cracks, gross cracks, and a higher number of dirty eggs.

Eggshell quality issue

Poor intestinal physiology can impair mineral absorption, notably calcium. When this happens, hens utilise the calcium from their bones, but if the problem persists, these stores may diminish and thin-shelled eggs may appear, increasing the percentage of broken eggs. Shell-less eggs are possible.

Bone fractures

 In continuation with what was described in the previous point, the bird’s skeletal system weakens due to the use of calcium reserves of the bones, which leads to bone fractures, such as the head of the femur, and other locomotor problems of similar pathogenesis.

Increase in soiled eggs percentage

Deficient intestinal physiology may also cause intestinal flora imbalance. Certain germs proliferate excessively, harming the mucosa and affecting faeces consistency. This raises the number of dirty eggs, which harms consumers due to cross-contamination.

Internal egg quality changes

Due to the alteration of the nutritional function of the intestine, feed digestion and nutrient absorption is affected, and this leads to a decrease in their concentration in the egg. This deficiency causes yolk pigmentation problems, poorer egg nutritional value, and worsening of the Haugh Units, among other issues.

 Low egg laying percentage and small egg size

Related to the previous point, the alteration of the nutritional functions of the intestine will also decrease the percentage of egg laying. This is because the bird will not absorb enough nutrients and minerals to cover the needs for egg production (both for the metabolic process and to form the egg). The mentioned problems, derived from inadequate intestinal physiology, lead to poor qualitative and quantitative egg production, which is, in most cases, very difficult to reverse in the short term, and that leads to significant economic losses.

Strategies for gut health maintenance

During the production cycle, the gastrointestinal health of laying hens has a substantial impact on both efficiency and profitability. During peak egg production, chickens often cannot consume enough feed to meet their protein and calcium requirements. This stress can disrupt the gut microbiota, resulting in pathogenic bacterial outbreaks. Infections with Escherichia coli and Clostridium perfringens are prevalent in laying hens. Antibiotics would be administered to the birds to deter severe mortality.

Antibiotics, on the other hand, have hidden costs because eggs produced during antibiotic treatment and withdrawal cannot be marketed for human consumption. Furthermore, antibiotic misuse, such as using too little or for too short a time, might contribute to the development of antibiotic resistance.

A variety of non‐drug substances have been promoted as aids to enhance gut health and to mitigate the risks of coccidiosis and necrotic enteritis in antibiotic‐free production. These products include phytogenic additives, probiotics, prebiotics, organic acids, yolk immunoglobulins, bacteriophages, yeast products, and others.

Probiotics and competitive exclusion (CE) cultures are available for hatchery application, usually by spray, and most of the alternatives are available for feed or water administration. Because of logistical issues, producers usually prefer feed‐administered products, especially if intended for large‐scale applications for prevention.

General water management guidelines

  1. Ensure adequate cleaning between flocks:
    • Removing biofilm (e.g., 25-50 ppm Hydrogen peroxide in the water line for 24-72 hours, then flush)
    • Removing scale (target a pH of 5 with weak acid, e.g. citric acid – leave in line for 24 hours, then flush)
  1. Prior to bird arrival
  • Use bleach solution in standing water
  • Flush just before birds arrive
  1. Throughout the life of the flock
  • Sanitize (e.g., Chlorine [2-4 ppm] or Chlorine dioxide [0.8 ppm])
  • Acidify water (pH 5.5-7)
  • Perform waterline biofilm removal at regular intervals throughout the life of the flock (biofilms can form in 6 weeks)
  • Routinely check ORP (oxygen reduction potential) at the drinker furthest from the water tank to check the efficacy of sanitation; it should be >650 mv)

Gut health additives

Many gut health solutions can be added to water, included in feed at the feed mill, or top-dressed at the farm. Gut health supplements work differently, making selection challenging. Some gut health products encourage beneficial bacteria, gut tissue formation, digestion, or pathogen inhibition. Thus, while choosing a gut health product, it’s important to determine the root cause of the challenge and make sure the product can address the problem.

The right products are also effective in antibiotic reduction initiatives. However, their prophylactic use should be considered as an alternative option. A strategic method is to deliver a gut-friendly substance at key periods in the chicken’s life.

What are the key periods?

Development, transition, and maintenance are three primary stages in the gut development chain (see Figure 2).

  1. Promote bacterial colonization as well as tissue and immunological improvement during development.
  2. The transition stage is when feed changes, vaccinations, and handling affect the intestinal environment. These events can alter the gut environment and enhance malabsorption and bacterial overgrowth.
  3. The gut has ceased developing and reached balance in the maintenance stage, but management or microbial problems can upset it, thus gut tissue support is still necessary.

 Understanding the needs of the gut at different points in the bird’s life and the main goals of gut health support at these times is important when designing gut health strategies.

Gut Need Assessment And Management StrategyFig2: Gut need assessment and management strategy

Phytomolecules mitigate gut health challenges

Multiple scientific studies highlight phytomolecules as one of the key elements in antibiotic-free production. These substances support digestion and improve the utilization of nutrients, resulting in a higher daily weight gain, uniform flock, and better feed utilization.

They also have a proven anti-inflammatory effect, as shown in Figure 3. NF-κB is a critical regulator for the expression of genes involved in inflammation. It has been demonstrated that NF-κB plays a novel role in the mechanism of increased epithelial permeability induced by inflammatory factors (including LPS and TNF-α) (5).

Phytomolecules, when combined with effective delivery and synergistic value inside the animal, also have a proven antimicrobial effect and help prevent the development of resistance. Various forms of stresses and insults from feed water and the environment cause oxidative stress and thereby impaired tight junctions, resulting in a leaky gut. Leaky gut has multiple consequences, ranging from poor flock performance to wet litter and raised ammonia levels. Phytomolecules are well documented for their NF-κB inhibitory and anti-inflammatory properties (6). They also help curb oxidative stress and maintain gut integrity. The right product will also be mild on the beneficial flora, showing selective antimicrobial activity and preserving the balance of the gut microbiota.

Finding the right product (perfect formulation and technology to counter high volatility, offer high thermostability, and yet provide effective delivery inside the animal) is of paramount importance for desired results.

NfkbFigure 3. NFkB activity with phytomolecule-based product Ventar D (EW Nutrition)

Conclusion

Optimal growth and FCR in food-producing animals depend on intestinal health. Researchers have studied gut flora, function, and immunity. Regional variations in chicken production, management styles, environment, disease challenge, and feed raw materials complicate gut health maintenance. Consequently, appropriate bird management techniques are essential to bird health, welfare, and performance.

Due to the recent focus on reducing or restricting antibiotic use, intestinal problems have increased, often resulting in productivity losses. This has led to the development of several feed additives that can improve intestinal microbiota, prevent pathogens from adhering to epithelial cells, and boost immune response.

Probiotics, prebiotics, organic acids, organic acid blends (protected or not), phytobiotics, and feed enzymes are everywhere. Feed additive performance depends on parameters like hen age, management, production method, genetics, etc. It also depends on additive formulation, a multi-layered mode of action, and on a coating technology that leads to effective release of ingredients in the GIT.

References:

  1. https://www.un.org/en/desa/world-population-projected-reach-98-billion-2050-and-112-billion-2100#:~:text=COVID%2D19,World%20population%20projected%20to%20reach%209.8%20billion%20in%202050%2C%20and,Nations%20report%20being%20launched%20today.
  2. Zaefarian, F., Abdollahi, M. R., & Ravindran, V. (2016). Particle size and feed form in broiler diets: impact on gastrointestinal tract development and gut health. World’s Poultry Science Journal72(2), 277-290.
  3. Zhao L, Feng Y, Wei J-T, Zhu M-X, Zhang L, Zhang J-C, Karrow NA, Han Y-M, Wu Y-Y, Guo Y-M, Sun L-H. Mitigation Effects of Bentonite and Yeast Cell Wall Binders on AFB1, DON, and OTA Induced Changes in Laying Hen Performance, Egg Quality, and Health. Toxins. 2021; 13(2):156. https://doi.org/10.3390/toxins13020156
  4. He, F., Peng, J., Deng, X. L., Yang, L. F., Camara, A. D., Omran, A., … & Yin, F. (2012). Mechanisms of tumor necrosis factor-alpha-induced leaks in intestine epithelial barrier. Cytokine59(2), 264-272.
  5. Dragoș, D., Petran, M., Gradinaru, T. C., & Gilca, M. (2022). Phytochemicals and Inflammation: Is Bitter Better?. Plants11(21), 2991.