EU publishes Short-term Outlook for Agricultural Markets (Autumn 2024)
The EU’s Short-term Outlook for Agricultural Markets (Autumn 2024) reveals significant challenges in agriculture, with adverse weather, geopolitical instability, and fluctuating trade conditions impacting production. The report identifies declining cereal and oilseed outputs, particularly for soft wheat and maize. Meanwhile, milk production is expected to remain stable despite a shrinking cow herd, and the meat sector shows mixed trends, with poultry production rising but pigmeat and beef facing structural challenges.
EU’s Short-term Outlook for Autumn 2024 highlights the following key findings collectively shaping EU agricultural markets:
Weather conditions: Severe drought in Southern and Eastern Europe and excess rainfall in Northwestern regions have reduced cereal and oilseed yields.
Energy and input costs: Inflation is stabilizing but remains high, with elevated prices for inputs like fertilizers and energy.
Geopolitical tensions: The ongoing war in Ukraine and trade disputes are disrupting supply chains and impacting exports.
Global demand: While global agricultural demand is recovering, trade flows face disruptions due to regulatory changes and volatile market conditions.
Cereals
The EU cereal production in 2024/25 is projected at 260.9 million tons, approximately 7% below the 5-year average. This marks the lowest production in the past decade, driven by unfavorable weather conditions, including excessive rain in Northwestern Europe, which impacted planting, particularly for soft wheat, and drought in Southern and Eastern regions, severely affecting maize yields. Production of soft wheat and maize is expected to decline year-on-year by 9.5% and 4%, respectively. On the other hand, barley and durum wheat production are increasing by about 6% and 3%, respectively, compared to the previous year.
EU cereal exports are projected to decline by 22% year-on-year due to reduced production and quality issues. At the same time, domestic demand remains relatively stable, with animal feed consumption holding steady as livestock production stagnates. In terms of prices, cereal prices fell throughout 2024, pressuring farmers’ cash flow, which could hinder their ability to afford inputs such as fertilizers in the coming year.
Milk and Dairy Products
The EU milk market is expected to see relatively stable supply, despite a continuously shrinking cow herd. Milk yields have increased, compensating for the herd’s decline. Milk prices are forecast to stabilize after a period of volatility in the past few years, remaining above historical averages, and input costs for farmers, such as feed and energy, are showing signs of stabilizing, allowing for a potential improvement in farmer margins.
Despite the stability in milk supply, demand for dairy products continues to show mixed trends, influenced by shifts in consumer preferences and trade dynamics. The balance of milk supply and prices could provide an opportunity for dairy farmers to recover some profitability after several challenging years.
In the dairy products sector, cheese and butter continue to dominate EU production, with butter production projected to rise slightly in 2024, driven by stable milk supplies and strong domestic demand. The demand for butter in the global market remains relatively strong, although competition is rising.
Cheese production is also expected to remain stable, reflecting a balance between domestic and export markets. The cheese sector has seen steady growth over the years, supported by increasing consumer demand for premium and specialty cheeses. The demand for skimmed milk powder (SMP) and whole milk powder (WMP) is projected to remain subdued due to fluctuating global demand, particularly from key markets such as China, although some growth is expected in non-European markets.
Meat Products
The meat sector in the EU remains a mixed picture, with structural changes and external factors shaping production and trade in 2024.
Beef and Veal: Beef production continues to face structural decline due to a shrinking herd size, with the sector stabilizing but at lower levels of production. The demand for EU beef remains relatively high, and exports are increasing, but domestic production is likely to remain constrained by environmental and economic pressures. Additionally, the number of animals has been declining consistently, reflecting longer-term trends within the EU beef industry.
Pigmeat: The EU pigmeat sector is facing diverse challenges, with some countries recovering from production setbacks, while others struggle with ongoing disease outbreaks and economic issues. The overall EU pigmeat production is expected to decline slightly, and exports have become less competitive, particularly with reduced demand from key markets such as China. However, opportunities exist in other Asian countries, where EU exporters are gaining ground. Domestically, consumption is forecast to decrease slightly, reflecting shifting consumer preferences toward plant-based alternatives and poultry.
Poultry: Poultry production is expected to rise, driven by strong domestic demand and favorable export conditions. The EU poultry sector has shown resilience, with increasing production and exports, despite higher input costs. Poultry remains a preferred source of protein for consumers, especially as prices for other meats rise. The sector continues to grow in competitiveness on the international stage, with exports expected to increase in 2024 despite the challenges posed by higher EU prices.
Sheep and Goat Meat: Production of sheep and goat meat continues to decline due to the structural reduction of flocks across the EU. High EU prices have made sheep and goat meat less competitive on the global market, reducing export opportunities. Domestically, consumption remains stable but at lower levels than other meat types. The ongoing structural decline in the sector highlights long-term challenges related to animal health, productivity, and market competitiveness.
Volatility and challenges persist
The report highlights the ongoing challenges faced by the cereals, dairy, and meat sectors. Weather conditions and global trade dynamics are shaping the future of EU agriculture, with many sectors grappling with production declines and shifting market demands. Despite these challenges, opportunities exist for some areas of growth, particularly in dairy and poultry, where rising consumer demand and stable supply conditions offer optimism for the future.
The art of silage: A guide to maximizing quality and nutritional value
by Vesna Jenkins, Global Product Manager, Biomin BioStabil
Silage quality directly impacts animal health and farm profitability. This guide delves into the scientific principles and practical steps necessary to produce silage of the highest caliber.
Optimal Dry Matter
The journey to exceptional silage begins with harvesting at the ideal dry matter percentage. This critical timing ensures the preservation of yield and energy content. Striking the right balance is key; harvesting too early can lead to nutrient-poor silage, while too late can compromise the forage’s structural integrity. Aim for a dry matter content of 32-38% depending on forage type for optimal results.
Wilting Wisdom
When wilting is part of the process (e.g. grass, clover or alfalfa silage), efficiency is paramount. Achieving the desired dry matter in just a few hours help to prevent spoilage and retain the forage’s nutritional value. It’s a delicate dance between removing excess moisture and maintaining the feed’s quality.
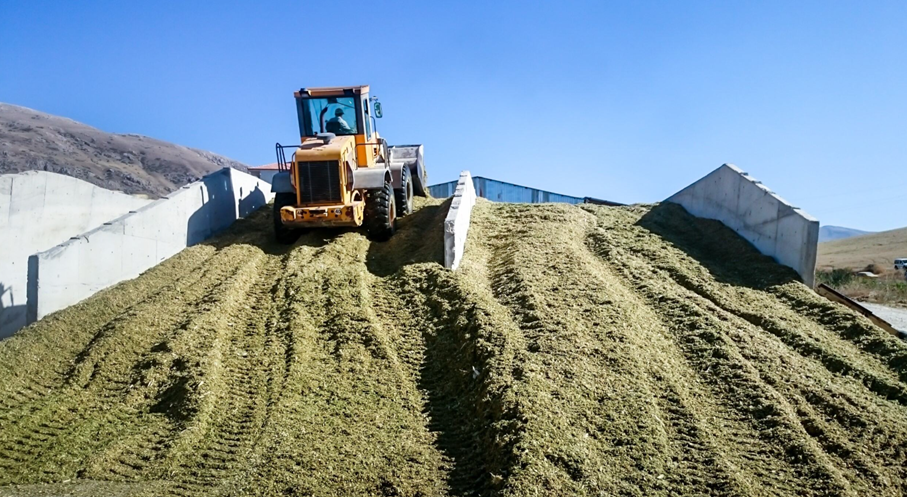
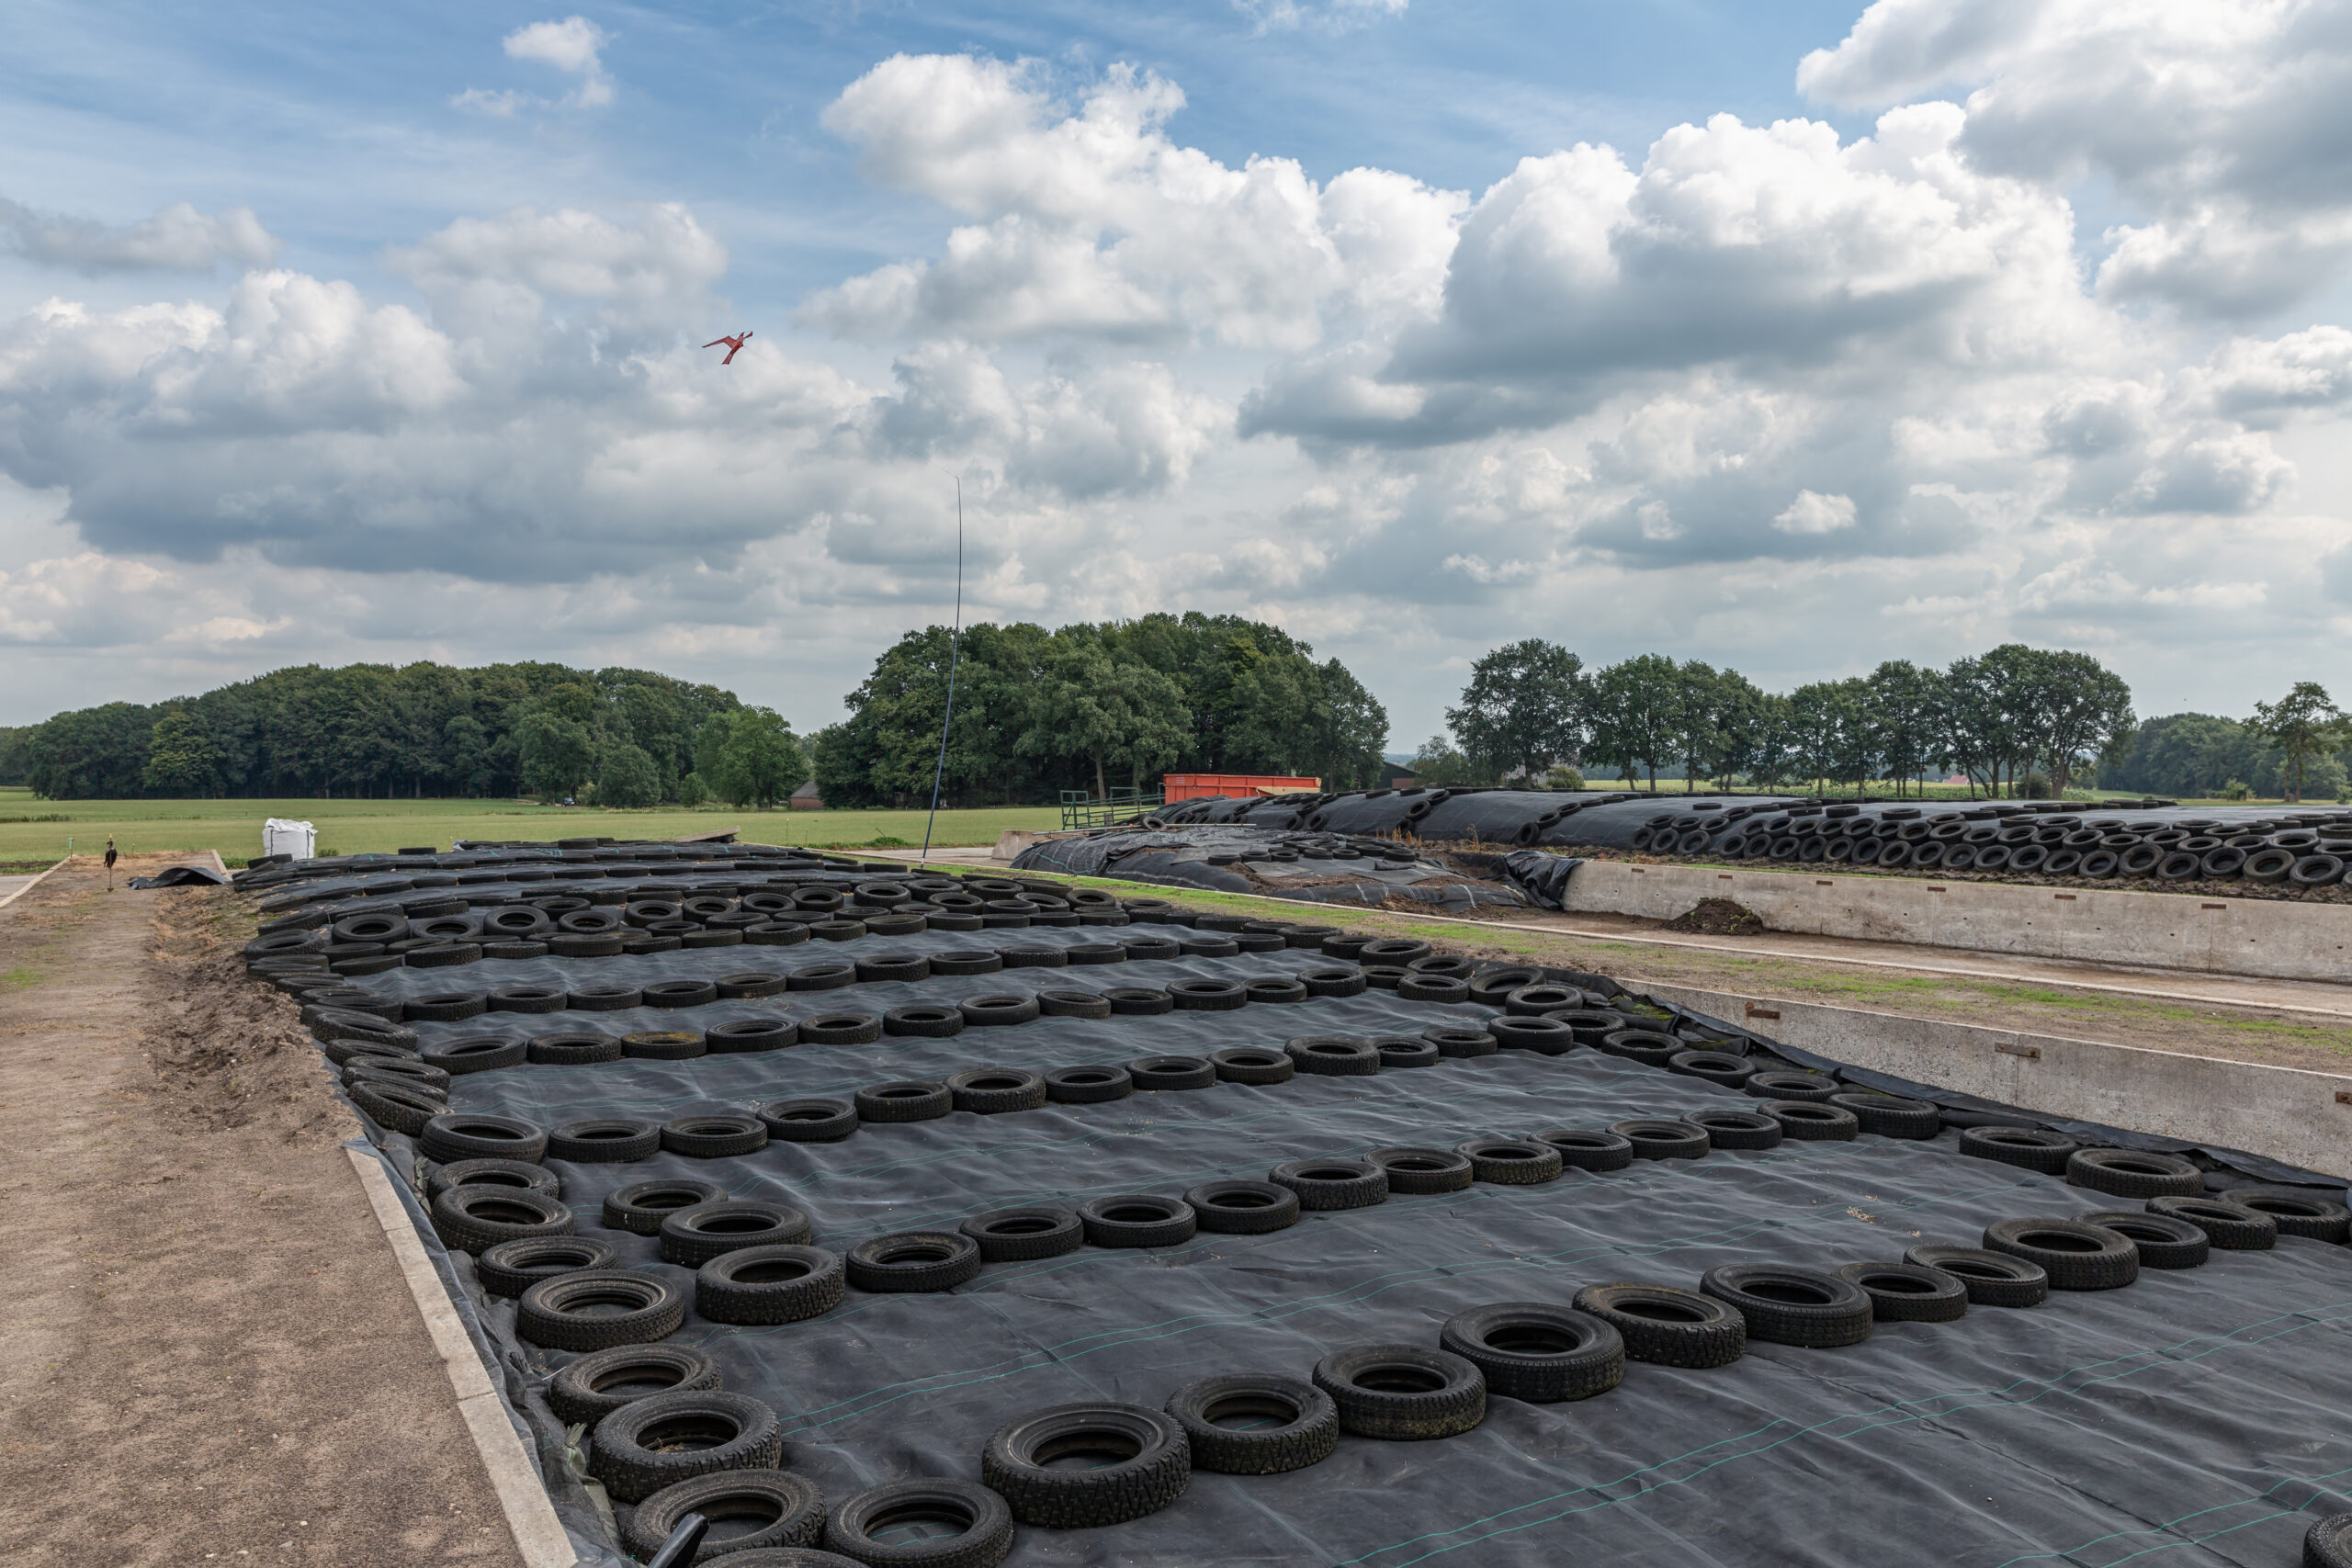
Ensiling Excellence
Post-harvest, the clock is ticking. Compacting and sealing the forage within 24 to 48 hours is vital to create an anaerobic environment. This step is crucial to ensure anaerobic conditions for optimal fermentation. Pack the silage in thin layers with heavy enough machinery such as dual wheeled heavy tractors to achieve optimal dry matter density of around 250 kg per cubic meter. Pay special attention to the edges for even compaction. Once filled, seal the clamp with high quality overlapping sheets ensuring the edges are weighted down to prevent air ingress.
Rapid Acidification
The role of silage inoculants cannot be overstated. The proven science of the silage inoculant Biomin® BioStabil accelerates the pH drop, locking in dry matter, energy, and protein. This rapid acidification is a defense mechanism against pathogenic bacteria and mycotoxin producing fungi, ensuring the silage remains safe and nutritious.
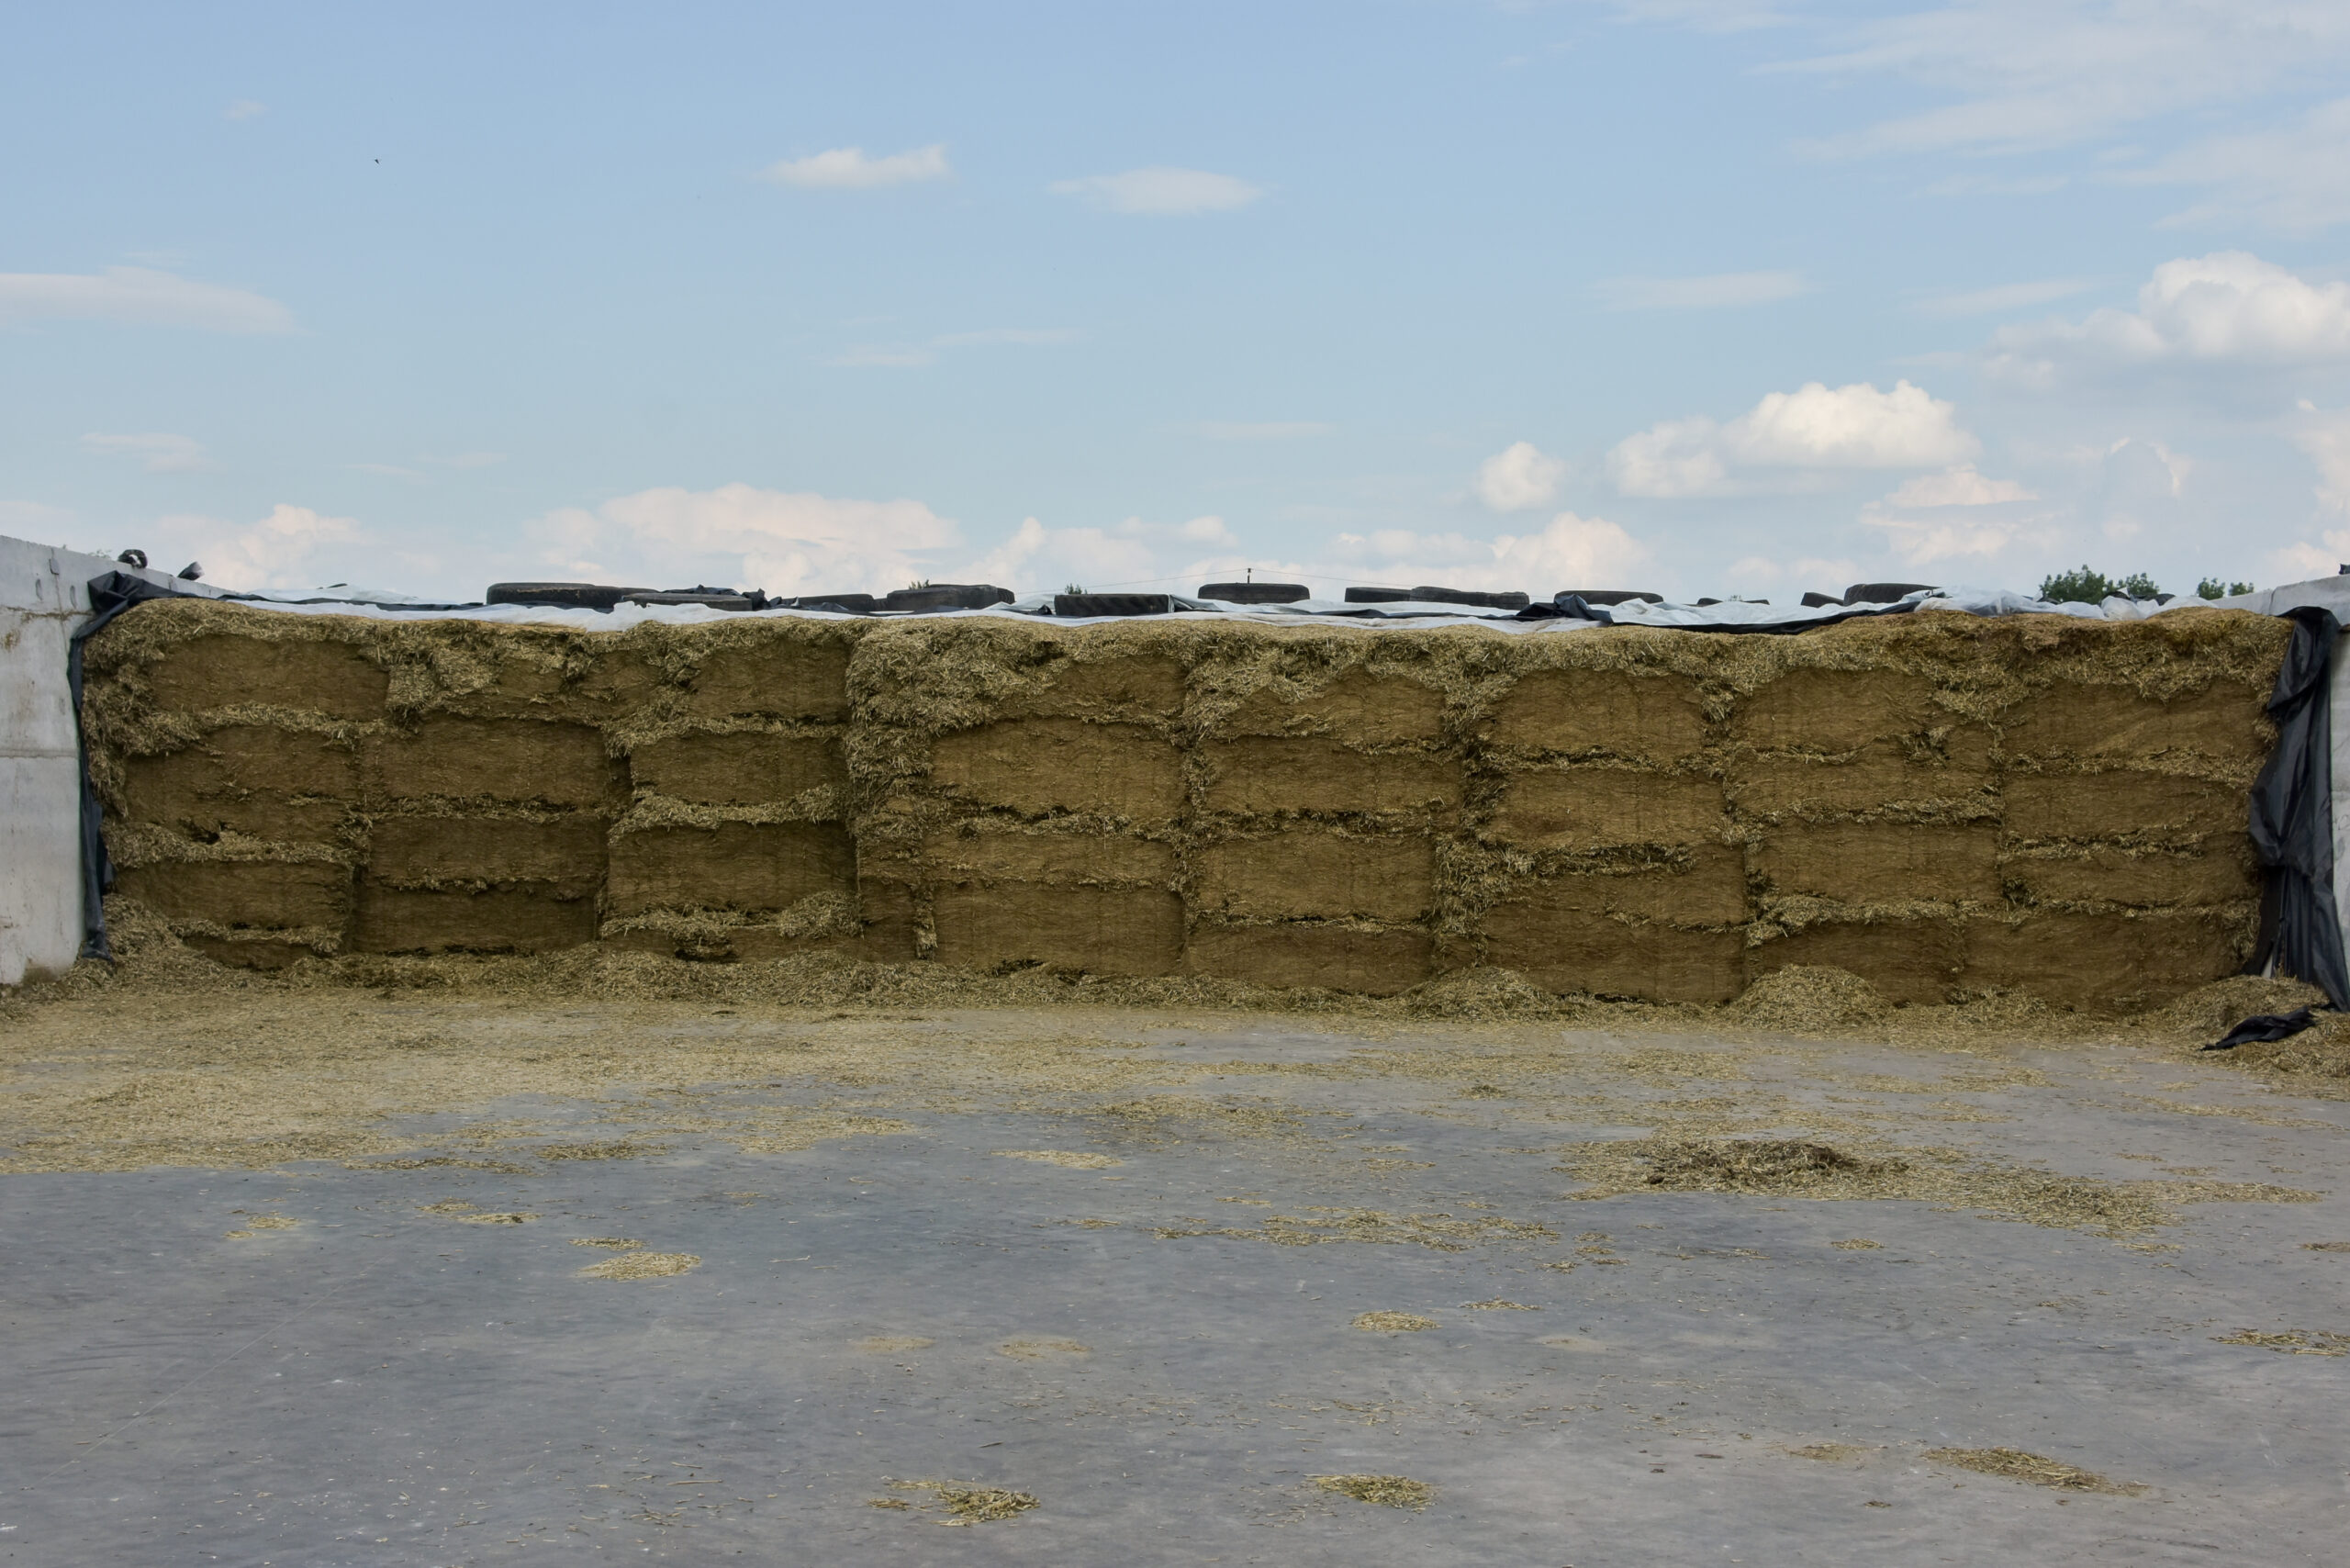
Feed-Out Finesse
Proper management of the clamp face is crucial to prevent spoilage and ensure livestock health. Cut sufficient depth fromthe clamp face daily to prevent newly exposed silage near the face from having time to spoil. Maintain a smooth and clean silage face to minimize spoilage. Spilled debris on the ground can easily go moldy, presenting hazards for animals if fed out. Use the proven silage inoculant Biomin® BioStabil for longer aerobic stability in the silage and TMR.
Silage making is both a science and an art. By following these guidelines and choosing the right inoculant, farmers can secure the nutritional integrity of their forage.
Consult with an EW Nutrition representative to select the perfect BioStabil inoculant tailored to your forage type and conditions, and elevate your silage from good to great.
Sustainable livestock farming: Progress since 1950
by Ilinca Anghelescu, Global Director Marketing Communications, EW Nutrition
Summary
Global GHG Emissions and Agriculture:
Agriculture-related emissions account for 31% of global anthropogenic emissions, with a growing share coming from food-related activities outside traditional farming, such as processing and transportation.
This represents a significant decrease from the 1950s when agriculture contributed to 58% of global emissions, a decrease largely due to the increased use of fossil fuels.
Population Growth and Emissions:
The global population has increased by 220% since 1950, leading to a threefold increase in agri-food emissions, now totaling 9-10 billion metric tons of CO2-equivalent annually.
Meat Production Growth:
Meat production has seen a 690% increase since 1950, driven by population growth, economic development, urbanization, technological advancements, and intensification of livestock production.
Technological improvements have significantly increased livestock yield, including higher carcass weights, improved feed efficiency, and greater output per animal.
Feed Conversion Ratio (FCR) as a Sustainability Metric:
FCR, which measures the efficiency of feed conversion into body mass, has improved dramatically for poultry, pigs, and cattle since the 1950s.
Improved FCR contributes to more efficient resource use, reduced environmental impact, better animal welfare, and economic viability.
Livestock Emissions and Land Use:
Livestock-related emissions have increased by 14% since 2000, with a significant portion coming from enteric fermentation in ruminants and land use changes.
Pasture and grazing land have expanded slightly, while the land for feed crops has increased substantially due to intensified livestock production.
Food Loss and Its Impact on Sustainability:
Food loss, occurring primarily before the consumer stage, remains stable at around 13%. Reducing food loss is critical for improving food security, economic efficiency, and minimizing the environmental footprint of livestock production.
Future Strategies for Sustainability:
The article emphasizes the need for ongoing investment in technology, optimization of feed efficiency, sustainable land use, and improved methods for tracking and reducing emissions to ensure the future sustainability of livestock farming.
As the global demand for animal products continues to rise, so do various claims about the impact of agriculture on greenhouse gas emissions. A study commissioned by the United Nations’ Food and Agriculture Organization (FAO) concluded that, according to the most recent data, agri-food system emissions totaled 16.5 billion metric tons of CO2 equivalent, representing 31% of global anthropogenic emissions.
Of these 31%, the most important trend highlighted by FAO was the “increasingly important role of food-related emissions generated outside of agricultural land, in pre- and post-production processes along food supply chains”. The food supply chain (food processing, packaging, transport, household consumption and waste disposal) is thus set to become the top GHG emitter, above farming and land use.
How bad is 31%?
While 31% is a large figure, even this estimate represents a significant decrease from the 1950s, when agri-food emissions constituted approximately 58% of total anthropogenic emissions: “From 1850 until around 1950, anthropogenic CO2 emissions were mainly (>50%) from land use, land-use change and forestry”, states the latest IPCC report.
Figure 1. Source: IPCC AR6 Report, 2023. LULUCF = Land Use, Land-Use Change and Forestry
As the IPCC graph in Figure 1 indicates, the percentage decrease is mostly due to the rising prevalence of oil and coal in CO2 emissions over the recent decades, as shown in Figure 2 below.
Annual greenhouse gas (GHG) emissions worldwide from 1990 to 2022, by sector (in million metric tons of carbon dioxide equivalent)
Total population and agri-food emission changes, 1950 – today
The global population increased by approximately 220%, from 2.5 billion in 1950 to 8 billion in 2023. In the meantime, estimates suggest that, in the 1950s, agri-food systems were responsible for approximately 2-3 billion metric tons of CO2-equivalent (CO2e) emissions per year. This figure includes emissions from livestock, rice paddies, fertilizer use, and land-use change (e.g., deforestation for agriculture).
Assessments generally agree that today’s agri-food systems contribute approximately 9-10 billion metric tons of CO2e annually, a threefold increase from 1950. This includes emissions from agriculture (e.g., livestock, crop production), food processing, transportation, and land-use changes.
This increase is consistent with FAO’s new findings, of food chain climbing to the top of agri-food emitters.
But where did these increased emissions come from?
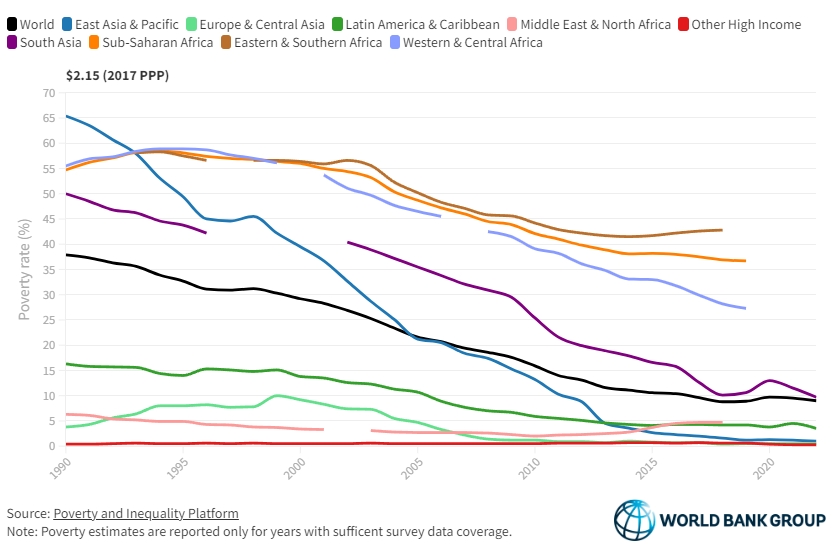
A look at the graph below gives us an indication: world poverty rate decreased massively between 1950 and today. While COVID brought a setback, the historical data would clearly indicate a correlation between the increased output in agri-food systems and the decreased rate of poverty.
How did poverty rates decline so steeply? The reasons lie, to a large extent, in technological innovation, especially in genetics and farm management, and in the increased apport of plentiful and affordable meat protein to the world. The numbers below build an image of an industry that produces better, more, and cheaper.
Global meat production: 1950 vs. Present
Then…
In 1950, the estimated total meat production was of approximately 45 million metric tons.
Key Producers: The United States, Europe, and the Soviet Union were the primary producers of meat. Types of Meat: Production was largely dominated by beef and pork, with poultry being less significant.
…and now
Now, the total meat production lies somewhere around 357 million metric tons (as of recent data from FAO)., representing a 53% increase from 2000 and a staggering 690% increase from 1950.
Key Producers: Major producers include China, the United States, Brazil, and the European Union. Types of Meat: Significant increases in poultry production, with pork remaining a leading source of meat, especially in Asia. Beef production has also increased, but at a slower rate than poultry and pork.
Factors contributing to increased meat production
Population Growth: The world population has grown from approximately 2.5 billion in 1950 to over 8 billion today, driving increased demand for meat.
Economic Growth and Urbanization: Rising incomes and urbanization have led to shifts in economic power and dietary preferences, with more people consuming higher quantities of meat, especially in developing countries.
Technological Advancements: Improvements in animal breeding, feed efficiency, and production systems have increased the efficiency and output of meat production.
Intensification of Livestock Production: The shift from extensive to intensive livestock production systems has allowed for higher meat yields per animal.
Global Trade: Expansion of global trade in meat and meat products has facilitated the growth of production in countries with comparative advantages in livestock farming.
Livestock yield increase, 1950 to the present
The increase in livestock yield for cattle, pigs, and chickens between 1950 and the present has been significant due to advances in breeding, nutrition, management practices, and technology.
Beef
1950s
Average Carcass Weight: In the 1950s, the average carcass weight of beef cattle was about 200 to 250 kilograms (440 to 550 pounds).
Dressing Percentage: The dressing percentage (the proportion of live weight that becomes carcass) was typically around 50-55%.
Present Day
Average Carcass Weight: Today, the average carcass weight of beef cattle is approximately 300 to 400 kilograms (660 to 880 pounds).
Dressing Percentage: The dressing percentage has improved to about 60-65%.
Increase in Beef Cattle Yield
Increase in Carcass Weight: The average carcass weight has increased by about 100 to 150 kilograms (220 to 330 pounds) per animal.
Improved Dressing Percentage: The dressing percentage has increased by about 5-10 percentage points, meaning a greater proportion of the live weight is converted into meat.
Dairy
1950s
Average Milk Yield per Cow: Approximately 2,000 to 3,000 liters per year, depending on the region.
Present Day
Average Milk Yield per Cow: Approximately 8,000 to 10,000 liters per year globally, with some countries like the United States achieving even higher averages of 10,000 to 12,000 liters per year.
Increase in Milk Yield:: Milk yield per cow has increased about 4-5 times due to genetic selection, improved nutrition, technological advancements, and better herd management.
Chickens (Layers)
1950s
Average Egg Production per Hen: In the 1950s, a typical laying hen produced about 150 to 200 eggs per year.
Present Day
Average Egg Production per Hen: Today, a typical laying hen produces approximately 280 to 320 eggs per year, with some high-performing breeds producing even more.
Increase in Egg Yield: The average egg production per hen has increased by approximately 130 to 170 eggs per year.
Chickens (Broilers)
1950s
Average Yield per Bird: In the 1950s, broiler chickens typically reached a market weight of about 1.5 to 2 kilograms (3.3 to 4.4 pounds) over a growth period of 10 to 12 weeks.
Present Day
Average Yield per Bird: Today, broiler chickens reach a market weight of about 2.5 to 3 kilograms (5.5 to 6.6 pounds) in just 5 to 7 weeks.
Increase in Yield: The average weight of a broiler chicken has increased by approximately 1 to 1.5 kilograms (2.2 to 3.3 pounds) per bird. Additionally, the time to reach market weight has been nearly halved.
Factors contributing to yield increases
Genetic Improvement:
Selective Breeding: Focused breeding programs have developed chicken strains with rapid growth rates and high feed efficiency, significantly increasing meat yield.
Nutrition:
Optimized Feed: Advances in poultry nutrition have led to feed formulations that promote faster growth and better health, using balanced diets rich in energy, protein, and essential nutrients.
Management Practices:
Housing and Environment: Improved housing conditions, including temperature and humidity control, have reduced stress and disease, enhancing growth rates.
Technological Advancements:
Automation: Automation in feeding, watering, and waste management has improved efficiency and bird health.
Health Monitoring: Advances in health monitoring and veterinary care have reduced mortality rates and supported faster growth.
Feed Conversion Efficiency:
Improved Feed Conversion Ratios (FCR): The amount of feed required to produce a unit of meat has decreased significantly, making production more efficient.
Why Feed Conversion Ratio is a sustainability metric
Feed Conversion Ratio (FCR) is a critical metric in livestock production that measures the efficiency with which animals convert feed into body mass. It is expressed as the amount of feed required to produce a unit of meat, milk, or eggs. Advances in nutrition and precision feeding allow producers to tailor diets that optimize FCR, reducing waste and improving nutrient uptake. Also, breeding programs focused on improving FCR can lead to livestock that naturally convert feed more efficiently, supporting long-term sustainability.
Poultry (Broilers): From the 1950s, improved from approximately 4.75 kg/kg to 1.7 kg/kg.
Pigs: From the 1950s, improved from about 4.5 kg/kg to 2.75 kg/kg.
Cattle (Beef): From the 1950s, improved from around 7.5 kg/kg to 6.0 kg/kg.
Figure 4. Evolution of FCR from 1950
FCR is crucial for livestock sustainability for several reasons, as shown below.
1. Resource efficiency
– Feed Costs: Feed is one of the largest operational costs in livestock production. A lower FCR means less feed is needed to produce the same amount of animal product, reducing costs and improving profitability.
– Land Use: Efficient feed conversion reduces the demand for land needed to grow feed crops, helping to preserve natural ecosystems and decrease deforestation pressures.
– Water Use: Producing less feed per unit of animal product reduces the water needed for crop irrigation, which is crucial in regions facing water scarcity.
2. Environmental impact
– Greenhouse Gas Emissions: Livestock production is a significant source of greenhouse gases (GHGs), particularly methane from ruminants and nitrous oxide from manure management. Improved FCR means fewer animals are needed to meet production goals, reducing total emissions.
– Nutrient Runoff: Efficient feed use minimizes excess nutrients that can lead to water pollution through runoff and eutrophication of aquatic ecosystems.
3. Animal welfare
– Health and Growth: Optimizing FCR often involves improving animal health and growth rates, which can lead to better welfare outcomes. Healthy animals grow more efficiently and are less susceptible to disease.
4. Economic viability
– Competitiveness: Lowering FCR improves the economic viability of livestock operations by reducing input costs and increasing competitiveness in the global market.
– Food Security: Efficient livestock systems contribute to food security by maximizing the output of animal protein relative to the input of resources.
Improving FCR is essential for achieving sustainability in livestock production. It leads to more efficient resource use, reduced environmental impact, enhanced economic viability, and supports the well-being of animals. As global demand for animal products continues to rise, optimizing FCR will be crucial in balancing production with the need to protect and preserve natural resources.
“The eight warmest years on record since 1961 (and in fact since the beginning of observations in 1880) are all within the eight-year period of 2015–2022. Europe is the region where the temperature change has been the highest in 2022 (and also for most of the 2000–2022 period), with 2.23 °C, followed by Asia (1.75 °C), the Americas (1.05 °C), Africa (1.01 °C) and Oceania (0.8 °C). The average temperature change in the 2010s was 1.25 °C, compared to 0.96 °C in the 2000s.” FAOSTAT 2023
Livestock emissions
Livestock emissions can be direct (farm-gate) or indirect (land use). Pre- and post-production emissions are considered separately, since they refer to emissions from manufacturing, processing, packaging, transport, retail, household consumption, and waste disposal.
Global farm-gate emissions (related to the production of crops and livestock) grew by 14% between 2000 and 2021, to 7.8 Gt CO2 eq, see below. 53% come from livestock-related activities, and the emissions from enteric fermentation generated in the digestive system of ruminant livestock were alone responsible for 37 percent of agricultural emissions (FAOSTAT 2023).
Land use emissions contribute a large share to agricultural emissions overall, especially through deforestation (~74% of land-use GHG emissions). The numbers have declined in recent years, to a total of 21% reduction between 2000 and 2018.
The other side of the coin is represented by the increased land usage for livestock, either directly for grazing or indirectly for feed crops.
1. Pasture and grazing land
1950: Approximately 3.2 billion hectares (7.9 billion acres) were used as permanent pastures.
Present: The area has increased to around 3.5 billion hectares (8.6 billion acres).
Change: An increase of about 0.3 billion hectares (0.7 billion acres).
2. Land for Feed Crops
1950: The land area dedicated to growing feed crops (such as corn and soy) was significantly less than today due to lower livestock production intensities and smaller scale operations. Feed crops likely accounted for about 200-250 million hectares of the cropland, although figures are evidently difficult to estimate.
Present: Of the approx. 5 billion hectares of land globally used for agriculture, about 1.5 billion hectares are dedicated to cropland.
The increase in cropland hectares is a direct consequence of the intensification of demand for livestock production. To keep these numbers in check, it is essential that producers strive to use as little feed as possible for as much meat yield as possible – and this directly relates to a key metric of the feed additive industry: Feed Conversion Ratio, mentioned above.
The role of food loss in livestock sustainability
The Food and Agriculture Organization (FAO) of the United Nations definesfood loss as the decrease in quantity or quality of food resulting from decisions and actions by food suppliers in the chain, excluding retail, food service providers, and consumers. Food loss specifically refers to food that gets spilled, spoiled, or lost before it reaches the consumer stage, primarily taking place during production, post-harvest, processing, and distribution stages.
Food loss is currently estimated to be relatively stable over the last decades, at around 13%.
Key aspects of food loss
Stages of Food Loss:
Production: Losses that occur during agricultural production, including damage by pests or diseases and inefficiencies in harvesting techniques.
Post-Harvest Handling and Storage: Losses that happen due to inadequate storage facilities, poor handling practices, and lack of proper cooling or processing facilities.
Processing: Losses during the processing stage, which may include inefficient processing techniques, contamination, or mechanical damage.
Distribution: Losses that occur during transportation and distribution due to poor infrastructure, inadequate packaging, and logistical inefficiencies.
Quality and Quantity:
Quality Loss: Refers to the reduction in the quality of food, affecting its nutritional value, taste, or safety, which may not necessarily reduce its quantity.
Quantity Loss: Refers to the actual reduction in the amount of food available for consumption due to physical losses.
Exclusions:
Retail and Consumer Level: Food loss does not include food waste at the retail or consumer levels, which is categorized as food waste. Food waste refers to the discarding of food that is still fit for consumption by retailers or consumers.
Importance of reducing food loss
Every step along the production chain, each action taken to preserve feed, increase yield, ensure stable and high meat quality, can contribute to reducing food loss and ensuring that animal protein production stays sustainable and feeds the world more efficiently.
Food Security: Reducing food loss can help improve food availability and access, particularly in regions where food scarcity is a concern. Where we thought we were on our way to eradicate world hunger, recent upticks in several regions show us that progress is not a given.
Economic Efficiency: Minimizing food loss can improve the efficiency and profitability of food supply chains by maximizing the utilization of resources.
Environmental Impact: Reducing food loss helps to decrease the environmental footprint of food production by lowering greenhouse gas emissions and minimizing land and water use. This is all the more important in regions where world hunger shows signs of going up. Perhaps not by coincidence are these regions some of the most affected by climate change.
By understanding and addressing the causes of food loss, stakeholders across the food supply chain can work towards more sustainable and efficient food systems.
What’s next?
Improving production practices and technology
Investment in research and development of new technologies that enhance livestock production efficiency and reduce environmental impact is vital for the future sustainability of the sector.
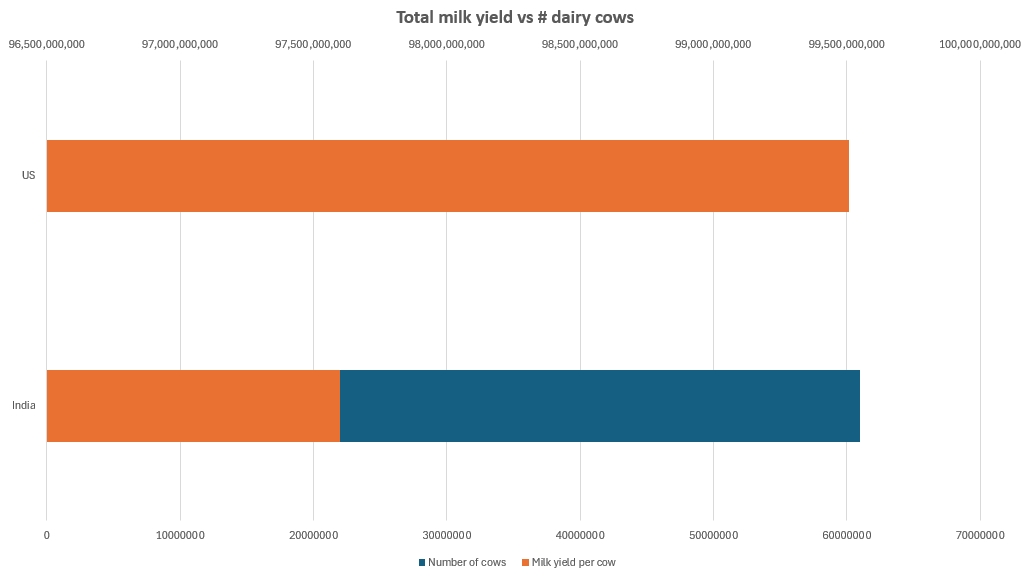
India is a good illustration of room to grow. If we look at cow milk alone, India, with a headcount of approximately 61 million animals, has a total milk production that is neck-and-neck with the United States, whose dairy cow headcount is in the neighborhood of 9.3 million. India’s milk yield sits around 1,600 liters/animal/year, compared to the US’s average of 10,700 liters.
Continued focus on improving FCR through genetic selection, optimized nutrition, and advanced management practices will be crucial for reducing the environmental footprint of livestock production.
Promoting Sustainable Land Use
Strategies to balance the need for increased livestock production with sustainable land use practices are essential. This includes adopting agroecological approaches and improving the efficiency of feed crop production.
Reducing Food Loss
Stakeholders across the food supply chain must prioritize reducing food loss through improved storage, transportation, and processing technologies. This will help ensure that livestock production contributes effectively to global food security.
Enhancing Emission Tracking and Reporting
There is a need for standardized methods for collecting and reporting data on GHG emissions in agriculture. This will enable more accurate assessments and the development of targeted strategies for emission reductions.
References
Bell, D. D. (2002). Laying hens in the U.S. market: An appraisal of trends from the beginning of the 20th century to present. Poultry Science, 81(5), 485-490. https://doi.org/10.1093/ps/81.5.485
Crippa, M., Solazzo, E., Guizzardi, D., Monforti-Ferrario, F., Tubiello, F. N., Leip, A., … & Janssens-Maenhout, G. (2022). Greenhouse gas emissions from food systems: building the global food system emissions database (GFED). Earth System Science Data, 14(4), 1795-1821. https://essd.copernicus.org/articles/14/1795/2022/essd-14-1795-2022.pdf
Goldewijk, K. K., & Verburg, P. H. (2013). Per-capita estimations of long-term historical land use and the consequences for global change research. Global Environmental Change, 23(4), 1166-1175. https://doi.org/10.1016/j.gloenvcha.2013.04.001
Kusuma, A. B., Laga, W. R., & Purnomo, H. (2022). Climate Change and Livestock Farming: Strategies for Mitigation and Adaptation. MDPI, 12(10), 1554. https://www.mdpi.com/2077-0472/12/10/1554
Roche, J. R., Friggens, N. C., Kay, J. K., Fisher, M. W., Stafford, K. J., & Berry, D. P. (2013). Invited review: Body condition score and its association with dairy cow productivity, health, and welfare. Animal Frontiers, 3(4), 23-29. https://doi.org/10.2527/af.2013-0032
Thornton, P. K., & Herrero, M. (2015). Impacts of climate change on the livestock food supply chain; a review of the evidence. Frontiers in Veterinary Science, 2, 93. https://www.ncbi.nlm.nih.gov/pmc/articles/PMC4686767/
Zuidhof, M. J., Schneider, B. L., Carney, V. L., Korver, D. R., & Robinson, F. E. (2014). Evolution of the modern broiler and feed efficiency. Annual Review of Animal Biosciences, 2(1), 47-71. https://doi.org/10.1146/annurev-animal-022513-114132
Global antimicrobial use in livestock farming: A revised estimate
Antimicrobial resistance (AMR) poses a significant threat to global health, driven by the overuse and misuse of antibiotics in both human medicine and livestock farming. In livestock farming, antimicrobials are still used extensively for therapeutic and non-therapeutic purposes. However, estimates of the quantities used per species are notoriously hard to derive from fragmented, incomplete, or unstandardized data around the world.
A recent article (“Global antimicrobial use in livestock farming: an estimate for cattle, chickens, and pigs”, Animal, 18(2), 2024) attempts to update the figures by estimating global biomass at treatment of cattle, pigs, and chickens, considering distinct weight categories for each species in biomass calculation, and using the European Medicines Agency’s weight standards for the animal categories. With these more refined calculations, authors Zahra Ardakani, Maurizio Aragrande, and Massino Canali aim to provide a more accurate estimate of global antimicrobial use (AMU) in cattle, chickens, and pigs. Understanding these patterns is crucial for addressing AMR and developing strategies for sustainable livestock management.
Key Findings
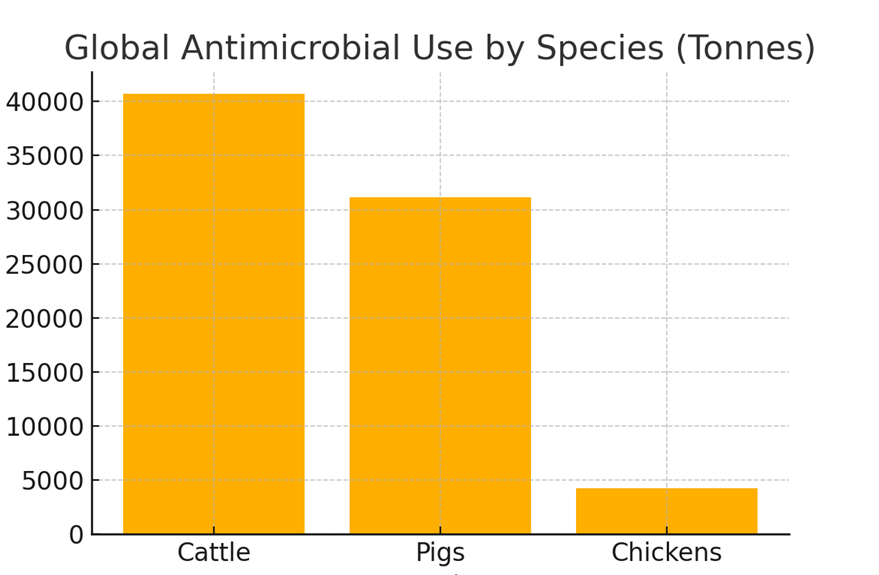
The study estimates that the global annual AMU for cattle, chickens, and pigs amounts to 76,060 tons of antimicrobial active ingredients. This is a significant revision from previous estimates due to a more detailed evaluation of animal weights and categories:
1. Cattle: 40,697 tons (53.5% of total AMU)
2. Pigs: 31,120 tons (40.9% of total AMU)
3. Chickens: 4,243 tons (5.6% of total AMU)
Figure 1: Distribution of global antimicrobial use among cattle, pigs, and chickens.
Methodology
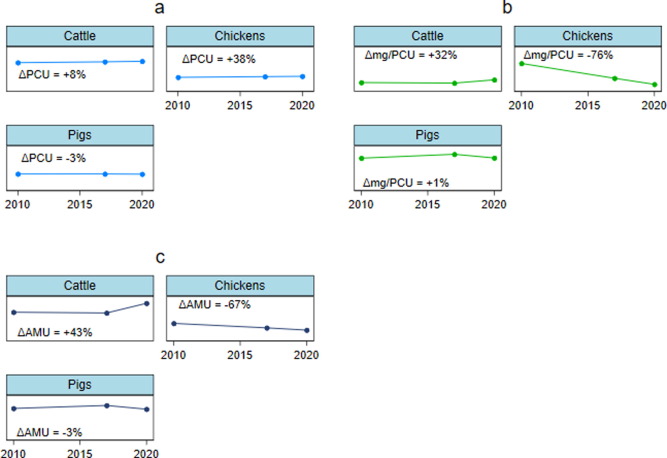
The study utilizes the concept of Population Correction Units (PCU) to estimate antimicrobial usage, taking into account the weight and category of livestock at the time of treatment. This method differs from previous approaches that relied on live weight at slaughter, providing a more accurate representation of AMU.
The PCU is calculated by multiplying the number of animals by their average weight during treatment. This approach allows for differentiation by age and sex, which is particularly important for species like cattle and pigs.
Figure 2: (a) Changes in global PCU (million tonnes), (b) changes in global antibiotic use in mg per PCU, and (c) changes in global AMU (thousand tonnes) for cattle, chickens, and pigs; between 2010 and 2020. Abbreviations: PCU = Population Correction Unit; AMU = Antibiotic Use.
Figure 2: (a) Changes in global PCU (million tonnes), (b) changes in global antibiotic use in mg per PCU, and (c) changes in global AMU (thousand tonnes) for cattle, chickens, and pigs; between 2010 and 2020. Abbreviations: PCU = Population Correction Unit; AMU = Antibiotic Use.
Study shows lower AMU than previous estimates
The study highlights a significant shift in AMU patterns, with chickens showing a remarkable decrease in antimicrobial use despite increased production. This is indicative of improved management and more responsible use of antibiotics in the poultry industry.
The lower AMU in cattle and pigs, compared to previous estimates, underscores the importance of considering animal age and weight at treatment. These findings align closely with World Organization for Animal Health (WOAH) estimates, validating the methodology.
However, the study also acknowledges limitations, including reliance on European standards for average weight at treatment, which may not reflect global variations. Additionally, the lack of comprehensive global data on veterinary antibiotics presents challenges in creating fully accurate estimates.
Corrected estimate highlights improved production advances
This study provides a revised and potentially more accurate estimate of global antimicrobial use in livestock. By accounting for the weight and treatment categories of animals, it offers insights that could guide policy and management practices to mitigate the spread of antimicrobial resistance.
The article also indicates that the industry may have over-estimated antimicrobial usage in livestock and, just as importantly, that antimicrobial use has been kept in check or even reduced, despite increases in farmed animal headcounts. The lower usage is likely due to regulatory oversight and improvements in alternative methods to control and mitigate health challenges.
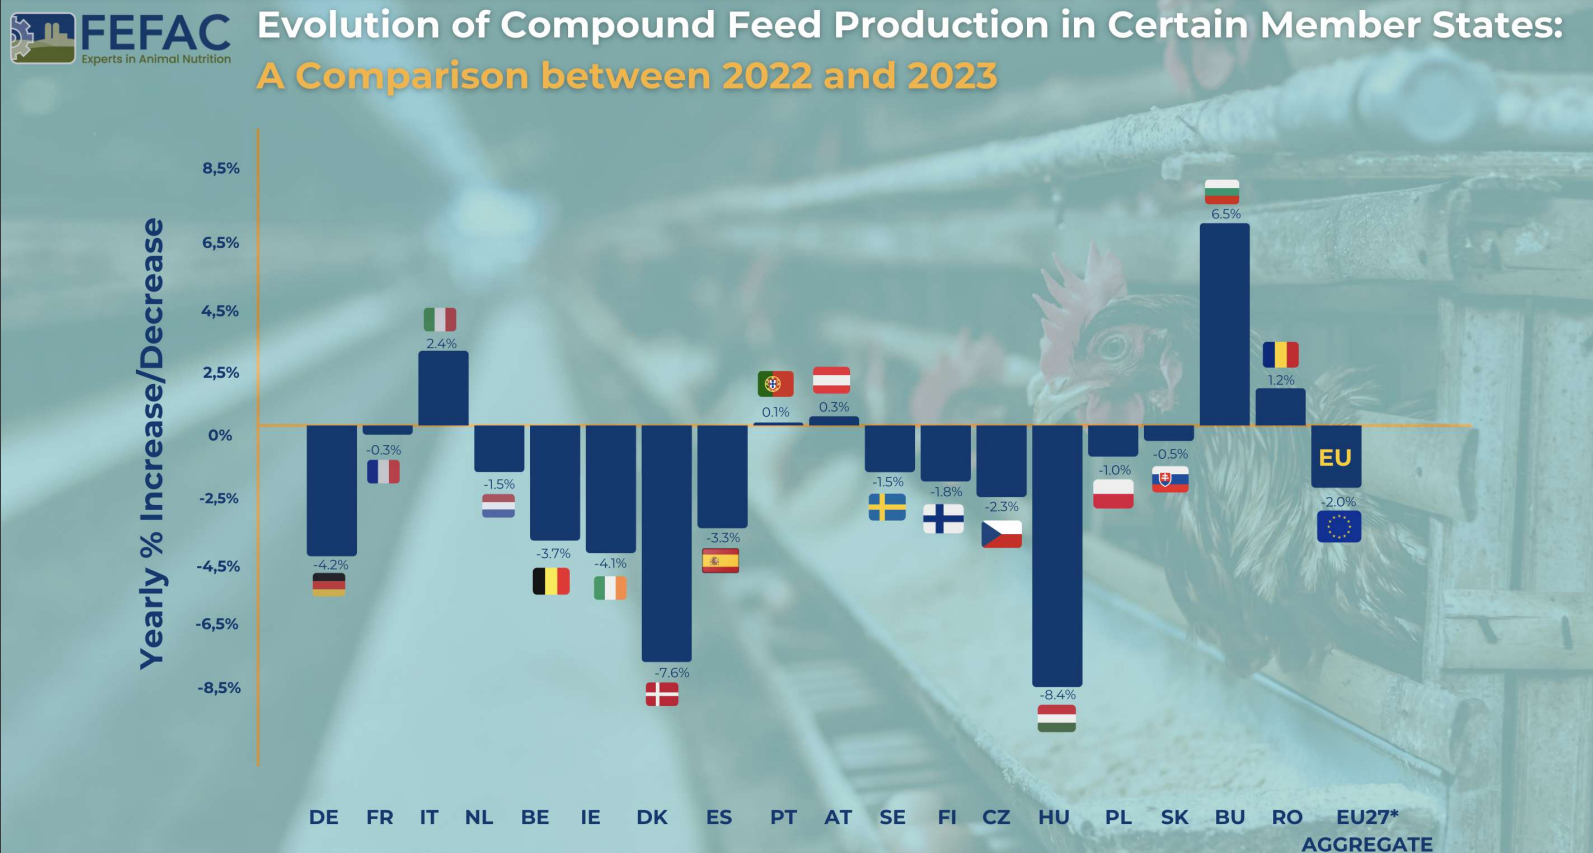
FEFAC: Quick Overview of 2023 EU Compound Feed Production
Total Production 2023: 144.3 million metric tons for farmed animals
Change from 2022: 2% decrease
Factors Influencing Decrease
Political and Market Pressures: Addressing crises and the shift towards sustainable feed.
Climate and Diseases: Effects of droughts, floods, Avian Influenza (AI), and African Swine Fever (ASF) on raw material supply and animal production.
National Policies: Initiatives for greenhouse gas and nitrate emission reduction.
Production Variability: Different trends across EU Member States, with notable decreases in countries like Germany, Ireland, Denmark, and Hungary, and slight increases in Austria, Bulgaria, Italy, and Romania.
Sector-Specific Trends
By Species
Pig Feed: Major decline of nearly 2.5 million tons. Key challenges included:
Loss of export markets, particularly in Asia
Negative media impact in Germany
Significant production drop in Denmark (-13.6%) and Spain (loss of 800,000 metric tons)
Italy’s ongoing struggle with ASF
Poultry Feed: Increase by 0.9 million tons, yet still 700,000 metric tons below 2021 levels. Challenges included declines in Hungary and Czechia due to reduced broiler production.
Cattle Feed: Decrease of 0.8 million tons from 2022.
“Green and animal welfare” policies affecting local production
Summary
The EU’s compound feed production in 2023 faced numerous challenges, leading to an overall decrease. The pig feed sector was most severely hit, while poultry feed showed some recovery. The influence of environmental, economic, and policy factors played a significant role in shaping these trends. Despite the price of feed cereals falling back to the levels seen before Russia’s invasion of Ukraine, these challenges will continue to be felt in 2024.
Ketosis: the most critical metabolic disease in dairy cows
Judith Schmidt, Product Manager On-Farm Solutions
Improvements in genetics, nutrition, and management continue to enhance dairy cows’ performance. However, being high-performance athletes comes at a cost, putting an extremely high burden on the animals’ energy metabolism. Especially around calving and during the first eight weeks of lactation, dairy cows can experience many stress factors: subclinical hypocalcemia, abomasum displacements, herd composition changes, or lameness. The more stress factors put the cows’ organism under pressure, the more likely they will become sick. A common consequence of stress is the occurrence of metabolic diseases, especially ketosis.
Both in terms of animal health and economic aspects, ketosis is probably the most critical dairy cow disease when also considering the correlated diseases. In this article, we explore the causes and consequences of ketosis and highlight prevention strategies that keep this issue under control.
Ketosis: causes and consequences
How ketosis develops
A restricted feed intake capacity and/or reduced energy concentration in the ration lead to a deficit in the animal’s energy balance. This situation occurs, for instance, at calving when the mother animal focuses her resources on the calf and its care. To compensate for the energy deficit, body fat is broken down for energy production. This process creates free fatty acids that accumulate in the liver and are partially converted into ketone bodies. These ketone bodies are a “transport medium” for energy, which various organs can use as an alternative energy source.
The problem arises when the deficiency lasts too long: more and more body fat is broken down, more and more fatty acids reach the liver, which leads to a fatty liver, and too high an amount of ketone bodies is formed and released into the blood. The ketone bodies in the blood inhibit appetite, resulting in less feed consumption and an energy deficit – the vicious cycle of ketosis begins.
Subclinical ketosis
Subclinical ketosis is defined as the stage of the disease at which an increased level of ketone bodies can be detected in the blood, urine, and milk. Furthermore, signs of hypoglycemia, increased levels of non-esterified fatty acid, and decreased hepatic gluconeogenesis can be seen in the blood. These conditions are typically not detected because there are no clinical signs.
Subclinical ketosis is a problem as it does not cause visible symptoms but leads to an increased incidence of subsequent diseases such as lab stomach displacement, clinical ketosis, and uterine inflammation. In addition, there may be loss of milk and fertility problems. Subclinically ill animals cannot be identified by the farmer by observation alone. Therefore, subclinical ketosis must be detected at an early stage to be able to act at the right time: prophylaxis instead of therapy.
There are several test possibilities to find out if an animal suffers from ketosis:
Milk: Milk test for ketosis detection has been available for many years. The results are to be obtained based on a color gamut. In contrast to blood analysis, the milk test does not evaluate exact values but shows a color change of the contained indicator. However, an increased milk cell content of the feeding of poorly fermented silages with a high butyric acid content significantly influences the result. The test often does not adequately reflect the actual conditions.
Urine: Another possibility is the examination of urine samples. Urine can be obtained spontaneously or with the help of a catheter. The results can also be read on a color scale of the urine test stripes. Like the milk test, the urine test only distinguishes different concentration ranges, but these are more finely graded than in the milk tests.
Blood: The most accurate but also most complex and expensive method is a blood test. It has the advantage that not only ketone bodies but also other parameters such as free fatty acids, minerals, and liver enzymes can be analyzed. In addition, the blood analysis results are evaluated in numbers and are more comparable than the color changes of test stripes. A good alternative is a rapid test by using a rapid test device, which is also used for measuring human blood sugar. A result is displayed with a drop of blood on a test strip within a few seconds.
Clinical ketosis
Depending on why there are elevated ketone body levels in the blood, we distinguish between primary and secondary clinical ketosis. For the primary form of clinical ketosis, the energy deficit itself (due to high performance and/or incorrect feeding) causes the condition. This form mainly occurs in susceptible, high-yielding dairy cows between the second and seventh weeks of lactation (Vicente et al., 2014). Secondary ketosis is caused indirectly by other diseases disease. A cow suffering from, for example, a claw disease might no longer consume a performance-based feed ration, leading to an energy deficit.
Typical symptoms
Typical of metabolic diseases, ketosis leads to a broad spectrum of symptoms. The classic symptoms at the beginning of the disease are a loss of appetite and decreased milk performance. As the disease develops, motor skills may be affected, and the excrement’s consistency becomes firmer and darker in color. The respiratory rate of sick animals increases, and they show dyspnea. Dyspnea is the medical description for breathing difficulties. Affected animals suffer from air shortage, which can occur in different situations. Due to the excretion of ketone bodies via the mucous membranes, the animals’ breath smells more or less strongly of acetone (Robinson and Williamson, 1977).
In addition, the animals undergo rapid and severe weight loss, and their general body conditions deteriorate noticeably. Furthermore, cows suffering from ketosis show increased milk fat content or an increased milk fat/protein quotient. Clinical symptoms include reduced general well-being, apathy, blindness, staggering, persistent “absent-minded” licking of the environment or overexcitability, muscle tremors, and aggressiveness (Andersson, 1984).
Effects on animal health and performance
Even in its subclinical form – if untreated – ketosis will engender health risks and reduced performance, negatively impacting milk yield and cows’ fertility. For clinical cases, typical effects include infertility, udder and hoof problems, and a fatty liver. Ketosis during early lactation is usually associated with fatty liver disease. In severe cases, the liver becomes enlarged and more fragile. It then no longer performs its detoxification function, toxic compounds increase, and the central nervous system is damaged. Anorexia or even a total loss of consciousness, the so-called hepatic coma, might ensue, ending in a complete liver function failure.
Direct economic costs range from high veterinary costs to the total loss of the dairy cow, i.e., approximately € 600 to € 1.000 per cow. Moreover, producers face indirect costs from secondary diseases such as fatty liver disease, increased postpartum behavior such as uterine infections, abomasum dislocations, or claw diseases.
Ketosis prevention: feeding and targeted supplementation
Feeding strategy
As part of the preparatory feeding, both dry and pregnant cows should receive rations that lead to an optimal (and not maximum) body condition at the time of calving. Animals with a poorer nutritional status do not have enough body fat reserves to compensate for lack of energy in the first phase of lactation. In more cases, animals have a too high BCS, leading to a risk of difficult births, and the cows have too little appetite at the beginning of lactation. These cows tend to show an excessive mobilization of fat reserves and develop a fatty liver. So prevention of ketosis of the current lactation starts with preventing a too-high BCS in the middle of the previous lactation.
The aim of feeding measures is to keep the lactating cow’s discrepancy between nutrient requirements and nutrient uptake as low as possible when the genetically determined performance potential is exhausted. For this reason, the ration must have a certain minimum energy density (high-quality forage and appropriate concentrate supplements). Also, anything that prevents the cows from ingesting the maximum amount of dry matter should be avoided.
Ket-o-Vital bolus for metabolic support
Another important preventive measure is the specific support of the calving cow’s liver, rumen, and immune system. EW Nutrition’s Ket-o-Vital Bolus was explicitly designed to reduce the risk of ketosis. It contains fast-available glucogenic substances, positively influencing the cow’s energy metabolism. Another advantage the bolus offers is the slow release of the contained cobalt, selenium, niacin, and active yeast:
Cobalt is a trace element important to form cobalamin, the so-called vitamin B12. It is essential for blood formation and the functioning of the nervous system.
Selenium protects cells from oxidative damage and ensures an intact immune defense;
Niacin is a B vitamin that intervenes in energy metabolism and prevents fatty liver syndrome;
And active yeast supports rumen health, preventing rumen acidosis and increasing feed intake.
The application of the Ket-o-Vital Bolus is profitable and straightforward. Only one bolus per application is required.
Ketosis control: be one step ahead
High-performance dairy cows are at risk of ketosis, which results in involuntary culling, poor health, and performance losses. Advanced feed management practices combined with the targeted use of the Ket-o-Vital bolus offer a solution for preventing this debilitating disease. The bolus protects the cows from clinical and subclinical ketosis, reduces metabolic disorders, increases appetite, and improves health – leading to a quick recovery and ensuring profitable production.
References
Vicente, Fernando, María Luisa Rodríguez, Adela Martínez-Fernández, Ana Soldado, Alejandro Argamentería, Mario Peláez, and Begoña de la Roza-Delgado. “Subclinical ketosis on dairy cows in transition period in farms with contrasting butyric acid contents in silages.” The Scientific World Journal 2014 (November 25, 2014): 1–4. https://doi.org/10.1155/2014/279614.
Andersson, L. “Concentrations of blood and milk ketone bodies, blood isopropanol and plasma glucose in dairy cows in relation to the degree of hyperketonaemia and clinical signs*.” Zentralblatt für Veterinärmedizin Reihe A 31, no. 1-10 (1984): 683–93. https://doi.org/10.1111/j.1439-0442.1984.tb01327.x.
Robinson, A. M., and D. H. Williamson. “Effects of acetoacetate administration on glucose metabolism in mammary gland of fed lactating rats.” Biochemical Journal 164, no. 3 (1977): 749–52. https://doi.org/10.1042/bj1640749.
Masked mycotoxins – particularly dangerous for dairy cows
By Si-Trung Tran, SEAP Regional Technical Manager, EW Nutrition
Marisabel Caballero, Global Technical Manager Poultry, EW Nutrition, and Inge Heinzl, Editor, EW Nutrition
Mycotoxins are secondary metabolites of fungi, commonly found as contaminants in agricultural products. In some cases, these compounds are used in medicine or industry, such as penicillin and patulin. In most cases, however, they are considered xenobiotics that are toxic to animals and humans, causing the disease collectively known as mycotoxicosis. The adverse effects of mycotoxins on human and animal health have been documented in many publications. Aflatoxins (AFs) and deoxynivalenol (DON, vomitoxin) are amongst the most critical mycotoxins affecting milk production and -quality.
Aflatoxins do not only affect cows
Aflatoxins (AFs) are highly oxygenated, heterocyclic difuranocoumarin compounds produced by Aspergillus flavus and Aspergillus parasiticus. They colonize crops, including many staple foods and feed ingredients. Within a group of over 20 AFs and derivatives, aflatoxin B1 (AFB1), B2, G1, and G2 are the most important naturally occurring compounds.
Among the aflatoxins, AFB1 is the most widespread and most toxic to humans and animals. Concern about mycotoxin contamination in dairy products began in the 1960s with the first reported cases of contamination by aflatoxin M1 (AFM1), a metabolite of AFB1 formed in the liver of animals and excreted in the milk.
There is ample evidence that lactating cows exhibit a significant reduction in feed efficiency and milk yield within a few days of consuming aflatoxin-contaminated feed. At the cellular level, aflatoxins cause degranulation of endoplasmic membranes, loss of ribosomes from the endoplasmic reticulum, loss of nuclear chromatin material, and altered nuclear shapes. The liver, as the organ mainly dealing with the decontamination of the organism, gets damaged, and performance drops. Immune cells are also affected, reducing immune competence and vaccination success (Arnold and Gaskill, 2023).
DON reduces cows’ performance
Another mycotoxin that can also reduce milk quality and affect metabolic parameters, as well as the immune function of dairy cows, is DON. DON is produced by different fungi of the Fusarium genus that infect plants. DON synthesis is associated with rainy weather from crop flowering to harvest. Whitlow and co-workers (1994) reported the association between DON and poor performance in dairy herds and showed decreased milk production in dairy cows fed 2.5 mg DON/kg. However, in cows fed 6 to 12 mg DON/kg dry matter for 10 weeks, no DON or its metabolite DOM-1 residues were detected in milk.
Masked mycotoxins hide themselves during analysis
Plants suffering from fungal infestations and thus confronted with mycotoxins convert the harmful forms of mycotoxins into less harmful or harmless ones for themselves by conjugation to sulfates, organic acids, or sugars. Conjugated mycotoxins cannot always be detected by standard analytical methods. However, in animals, these forms can be released and transformed into parent compounds by enzymes and microorganisms in the gastrointestinal tract. Thus, the feed may show a concentration of mycotoxins that is still below the limit value, but in the animal, this concentration is suddenly much higher. In dairy cows, the release of free mycotoxins from conjugates during digestion may play an important role in understanding the silent effects of mycotoxins.
Fusarium toxins, in particular, frequently occur in this “masked form”. They represent a serious health risk for animals and humans.
Aflatoxins first show up in the milk
Masked aflatoxins may also play a role in total aflatoxin contamination of feed materials. Research has harvested little information on masked aflatoxins that may be present in TMR ingredients. So far, metabolites such as Aflatoxin M2 have been identified (Righetti, 2021), which may reappear later in milk as AFM1.
DON-related symptoms without DON?
Sometimes, animals show DON-related symptoms, with low levels detected in the feed or raw materials. Besides sampling errors, this enigma could be due to conjugated or masked DON, which is structurally altered DON bound to various compounds such as glucose, fatty acids, and amino acids. These compounds escape conventional feed analysis techniques because of their modified chemical properties but can be released as their toxic precursors after acid hydrolysis.
Masked DON was first described in 1984 by Young and co-workers, who found that the DON content of yeast-fermented foods was higher than that of the contaminated wheat flour used in their production. The most plausible reason for this apparent increase was that the toxin from the wheat had been converted to a compound other than DON, which could be converted back to DON under certain conditions. Since this report, there has been much interest in conjugated or masked DON.
Silage: masked DON is a challenge for dairy producers
Silage is an essential feed for dairy cows, supporting milk production. Most silage is made from corn and other grains. The whole green plant is used, which can be infected by fungi. Since infection of corn with Fusarium spp. and subsequent DON contamination is usually a major problem in the field worldwide, a relatively high occurrence of this toxin in silage must be expected. The ensiling process may reduce the amount of Fusarium fungi, but the DON formed before ensiling is very stable.
Silage samples show DON levels of concern
It is reasonable to assume that the DON biosynthesized by the fungi was metabolized by the plants to a new compound and thus masked DON. Under ensiling conditions, masked DON can be hydrolyzed, producing free DON again. Therefore, the level of free DON in the silage may not reflect the concentration measured in the plants before ensiling.
A study analyzed 50 silage samples from different farms in Ontario, Canada. Free DON was found in all samples, with levels ranging from 0.38 to 1.72 µg/g silage (unpublished data). Eighty-six percent of the samples contained DON at concentrations higher than 0.5 µg/g. Together with masked DON, it poses a potential threat to dairy cattle.
Specific hydrolysis conditions allow detection
However, in the natural ensiling process, the conditions for hydrolysis of masked DON are not optimal. The conditions that allow improved analysis of masked DON were recently described. This method detected masked DON in 32 of 50 silage samples (64%) along with free DON, increasing DON concentration by 23% in some cases (unpublished data).
Mycotoxins impact humans and animals
Aflatoxins, as well as DON, have adverse effects. In the case of DON, the impact on the animal is significant; in the case of aflatoxin, the possible long-term effects on humans are of higher relevance.
DON has more adverse effects on the animal and its performance
Unlike AFs, DON may be found in milk at low or trace concentrations. It is more associated with negative effects in the animal, altered rumen fermentation, and reduced flow of usable protein into the duodenum. For example, milk fat content was significantly reduced when cows were fed 6 µg DON/kg. However, the presence of DON also indicates that the feed probably contains other mycotoxins, such as zearalenone (ZEA) (estrogenic mycotoxin) and fusaric acid (pharmacologically active compound). All these mycotoxins may interact to cause symptoms that are different or more severe than expected, considering their individual effects. DON and related compounds also have immunosuppressive effects, resulting in increased somatic cell counts in milk. The U.S. FDA has established an action level for DON in wheat and wheat-derived products intended for cows, which is 5µg DON/g feed and the contaminated ingredient must not exceed 40% of the ration.
Aflatoxins decrease milk quality and pose a risk to humans
Aflatoxins are poorly degraded in the rumen, with aflatoxicol being the main metabolite that can be reconverted to AFB1. Most AFs are absorbed and extensively metabolized/hydrolyzed by enzymes found mainly in the liver. This results in the formation of AFM1, a part of which is conjugated to glucuronic acid and subsequently excreted in the bile. The other part enters the systemic circulation. It is either excreted in urine or milk. AFM1 appears within 12-48 hours after ingestion in cow’s milk. The excreted amount of AFM1 in milk from dairy cows usually ranges from 0.17% to 3% of the ingested AFB1. However, this carryover rate may vary from day to day and from one milking to the next in individual animals, as it is influenced by various factors, such as feeding regime, health status, individual biotransformation capacity, and, of course, by actual milk production. Carryover rates of up to 6.2% have been reported in high-yielding dairy cows producing up to 40 liters of milk per day.
In various experiments, AFM1 showed both carcinogenic and immunosuppressive effects. Accordingly, the International Agency for Research on Cancer (IARC) classified AFM1 as being in Group 2B and, thus, possibly carcinogenic in humans. The action level of 0.50 ppb and 0.05 ppb for AFM1 in milk is strictly adhered to by the U.S. Food and Drug Administration (FDA) and the European Food Safety Authority (EFSA), respectively.
Trials show the high adsorption capacity of Solis Max
A trial was conducted at an independent laboratory located in Spain. The evaluation of the performance of Solis Max was executed with the following inclusion levels:
0.10% equivalent to 1.0 kg of Solis Max per ton of feed
0.20% equivalent to 2.0 kg of Solis Max per ton of feed
A phosphate buffer solution at pH 7 was prepared for the trial to simulate rumen conditions. Each mycotoxin was tested separately, preparing solutions with known contamination (final concentration described in the table below). The contaminated solutions were divided into 3 parts: A positive control, 0.10% Solis Max and 0.20% Solis Max. All samples were incubated at 41°C for 1 hour, centrifuged, and the supernatant was analyzed for the mycotoxin added to determine the binding efficacy. All analyses were carried out by high-performance liquid chromatography (HPLC) with standard detectors.
Mycotoxin
Contamination Level (ppb)
Aflatoxin B1
800
DON
800
Fumonisin B1
2000
ZEA
1200
Results: The higher concentration of Solis max showed a higher adsorption rate for most mycotoxins. The high dose of Solis Max adsorbed 99% of the AFB1 contamination. In the case of DON, more than 70% was bound. For fumonisin B1 and zearalenone, Solis max showed excellent binding rates of 87.7% and 78.9%, respectively (Figure 1).
Figure 1: Solis Max showed a high binding capacity for the most relevant mycotoxins
Another trial was conducted at an independent laboratory serving the food and feed industry and located in Valladolid, Spain.
All tests were carried out as duplicates and using a standard liquid chromatography/mass spectrometry (LC/MS/MS) quantification. Interpretation and data analysis were carried out with the corresponding software. The used pH was 3.0, toxin concentrations and anti-mycotoxin agent application rates were set as follows (Table 1):
Table 1: Trial set-up testing the binding capacity of Solis Plus 2.0 for several mycotoxins in different contamination levels
Results:
Under acidic conditions (pH3), Solis Plus 2.0 effectively adsorbs the three tested mycotoxins at low and high levels. 100% binding of aflatoxin was achieved at a level of 150ppb and 98% at 1500ppb.In the case of fumonisin, 87% adsorption could be reached at 500ppb and 86 for a challenge with 5000ppb. 43% ochratoxin was adsorbed at the contamination level of 150ppb and 52% at 1500ppb.
Figure 2: The adsorption capacity of Solis Plus 2.0 for three different mycotoxins at two challenge levels
Mycotoxins – Effective risk management is of paramount importance
Although the rumen microflora may be responsible for conferring some mycotoxin resistance to ruminants compared to monogastric animals, there are still effects of mycotoxins on rumen fermentation and milk quality. In addition, masked mycotoxins in feed present an additional challenge for dairy farms because they are not readily detectable by standard analyses.
Feeding dairy cows with feed contaminated with mycotoxins can lead to a reduction in milk production. Milk quality may also deteriorate due to an adverse change in milk composition and mycotoxin residues, threatening the innocuousness of dairy products. Dairy farmers should therefore have feed tested regularly, consider masked mycotoxins, and take action. EW Nutrition’s MasterRisk tool provides a risk evaluation and corresponding recommendations for the use of products that mitigate the effects of mycotoxin contamination and, in the end, guarantee the safety of all of us.
Fighting antimicrobial resistance with immunoglobulins
By Lea Poppe, Regional Technical Manager On-Farm Solutions Europe, and Dr. Inge Heinzl, Editor
One of the ten global public health threats is antimicrobial resistance (AMR). Jim O’Neill predicted 10 million people dying from AMR annually by 2050 (O’Neill, 2016). The following article will show the causes of antimicrobial resistance and how antibodies from the egg could help mitigate the problem of AMR.
Global problem of AMR results from the incorrect use of antimicrobials
Antimicrobial substances are used to prevent and cure diseases in humans, animals, and plants and include antibiotics, antivirals, antiparasitics, and antifungals. The use of these medicines does not always happen consciously, partially due to ignorance and partially for economic reasons.
There are various possibilities for the wrong therapy
The use of antibiotics against diseases that household remedies could cure. A recently published German study (Merle et al., 2023) confirmed the linear relationship between treatment frequency and resistant scores in calves younger than eight months.
The use of antibiotics against viral diseases: antibiotics only act against bacteria and not against viruses. Flu, e.g., is caused by a virus, but doctors often prescribe an antibiotic.
Using broad-spectrum antibiotics instead of determining an antibiogram and applying a specific antibiotic.
A too-long treatment with antimicrobials so that the microorganisms have the time to adapt. For a long time, the only mistake you could make was to stop the antibiotic therapy too early. Today, the motto is “as short as possible”.
Let’s take the example of neonatal calf diarrhea, one of the most common diseases with a high economic impact. Calf diarrhea can be caused by a wide range of bacteria, viruses, or parasites. This infectious form can be a complication of non-infectious diarrhea caused by dietary, psychological, and environmental stress (Uetake, 2012). The pathogens causing diarrhea in calves can vary with the region. In Switzerland and the UK, e.g., rotaviruses and cryptosporidia are the most common pathogens, whereas, in Germany, E. coli is also one of the leading causes. To minimize the occurrence of AMR, it is always crucial to know which pathogen is behind the disease.
Prophylactic use of antibiotics is still a problem
The use of low doses of antibiotics to promote growth. This use has been banned in the EU now for 17 years now, but in other parts of the world, it is still common practice. Especially in countries with low hygienic standards, antibiotics show high efficacy.
The preventive use of antibiotics to help, e.g., piglets overcome the critical step of weaning or to support purchased animals for the first time in their new environment. Antibiotics reduce pathogenic pressure, decrease the incidence of diarrhea, and ensure the maintenance of growth.
Within the scope of prophylactic use of antimicrobials, also group treatment must be mentioned. In veal calves, group treatments are far more common than individual treatments (97.9% of all treatments), as reported in a study documenting medication in veal calf production in Belgium and the Netherlands. Treatment indications were respiratory diseases (53%), arrival prophylaxis (13%), and diarrhea (12%). On top, the study found that nearly half of the antimicrobial group treatment was underdosed (43.7%), and a large part (37.1%) was overdosed.
However, in several countries, consumers request reduced or even no usage of antibiotics (“No Antibiotics Ever” – NAE), and animal producers must react.
Today’s mobility enables the spreading of AMR worldwide
Bacteria, viruses, parasites, and fungi that no longer respond to antimicrobial therapy are classified as resistant. The drugs become ineffective and, therefore, the treatment of disease inefficient or even impossible. All the different usages mentioned before offer the possibility that resistant bacteria/microorganisms will occur and proliferate. Due to global trade and the mobility of people, drug-resistant pathogens are spreading rapidly throughout the world, and common diseases cannot be treated anymore with existing antimicrobial medicines like antibiotics. Standard surgeries can become a risk, and, in the worst case, humans die from diseases once considered treatable. If new antibiotics are developed, their long-term efficacy again depends on their correct and limited use.
Different approaches are taken to fight AMR
There have already been different approaches to fighting AMR. As examples, the annually published MARAN Report compiled in the Netherlands, the EU ban on antibiotic growth promoters in 2006, “No antibiotics ever (NAE) programs” in the US, or the annually published “Antimicrobial resistance surveillance in Europe” can be mentioned. One of the latest approaches is an advisory “One Health High-Level Expert Panel” (OHHLEP) founded by the Food and Agriculture Organization of the United Nations (FAO), the World Organization for Animal Health (OIE), the United Nations Environment Program (UNEP), and the World Health Organization (WHO) in May 2021. As AMR has many causes and, consequently, many players are involved in its reduction, the OHHLEP wants to improve communication and collaboration between all sectors and stakeholders. The goal is to design and implement programs, policies, legislations, and research to improve human, animal, and environmental health, which are closely linked. Approaches like those mentioned help reduce the spread of resistant pathogens and, with this, remain able to treat diseases in humans, animals, and plants.
On top of the pure health benefits, reducing AMR improves food security and safety and contributes to achieving the Sustainable Development Goals (e.g., zero hunger, good health and well-being, and clean water).
Prevention is better than treatment
Young animals like calves, lambs, and piglets do not receive immunological equipment in the womb and need a passive immune transfer by maternal colostrum. Accordingly, optimal colostrum management is the first way to protect newborn animals from infection, confirmed by the general discussion on the Failure of Passive Transfer: various studies suggest that calves with poor immunoglobulin supply suffer from diarrhea more frequently than calves with adequate supply.
Especially during the immunological gap when the maternal immunoglobulins are decreasing and the own immunocompetence is still not fully developed, it is crucial to have a look at housing, stress triggers, biosecurity, and the diet to reduce the risk of infectious diseases and the need for treatments.
Immunoglobulins from eggs additionally support young animals
Also, if newborn animals receive enough colostrum in time and if everything goes optimally, the animals suffer from two immunity gaps: the first one occurs just after birth before the first intake of colostrum, and the second one occurs when the maternal antibodies decrease, and the immune system of the young animal is still not developed completely. These immunity gaps raise the question of whether something else can be done to support newborns during their first days of life.
The answer was provided by Felix Klemperer (1893), a German internist researching immunity. He found that hens coming in contact with pathogens produce antibodies against these agents and transfer them to the egg. It is unimportant if the pathogens are relevant for chickens or other animals. In the egg, the immunoglobulins usually serve as an immune starter kit for the chick.
Technology enables us today to produce a high-value product based on egg powder containing natural egg immunoglobulins (IgY – immunoglobulins from the yolk). These egg antibodies mainly act in the gut. There, they recognize and tie up, for example, diarrhea-causing pathogens and, in this way, render them ineffective.
The efficacy of egg antibodies was demonstrated in different studies (Kellner et al., 1994; Erhard et al., 1996; Ikemori et al., 1997; Yokoyama et al., 1992; Marquart, 1999; Yokoyama et al., 1997) for piglets and calves.
Trial proves high efficacy of egg immunoglobulins in piglets
One trial conducted in Germany showed promising results concerning the reduction of mortality in the farrowing unit. For the trial, 96 sows and their litters were divided into three groups with 32 sows each. Two of the groups orally received a product containing egg immunoglobulins, the EP -1 + 3 group on days 1 and 3 and the EP – 1 + 2 + 3 group on the first three days. The third group served as a control. Regardless of the frequency of application, the egg powder product was very supportive and significantly reduced mortality compared to the control group. The measure resulted in 2 additionally weaned piglets than in the control group.
Egg immunoglobulins support young dairy calves
IgY-based products were also tested in calves to demonstrate their efficacy. In a field trial conducted on a Portuguese dairy farm with 12 calves per group, an IgY-containing oral application was compared to a control group without supplementation. The test product was applied on the day of birth and the two consecutive days. Key observation parameters during a two-week observation period were diarrhea incidence, onset, duration, and antibiotic treatments, the standard procedure on the trial farm in case of diarrhea. On-farm tests to check for the pathogenic cause of diarrhea were not part of the farm’s standards.
In this trial, 10 of 12 calves in the control group suffered from diarrhea, but in the trial group, only 5 calves. Total diarrhea and antibiotic treatment duration in the control group was 37 days (average 3.08 days/animal), and in the trial group, only 7 days (average 0.58 days/animal). Additionally, diarrhea in calves of the Globigen Calf Paste group started later, so the animals already had the chance to develop an at least minimally working immune system.
The supplement served as an effective tool to support calves during their first days of life and to reduce antibiotic treatments dramatically.
Conclusion
Antimicrobial reduction is one of the biggest tasks for global animal production. It must be done without impacting animal health and parameters like growth performance and general cost-efficacy. This overall demand can be supported with a holistic approach considering biosecurity, stress reduction, and nutritional support. Feed supplements such as egg immunoglobulins are commercial options showing great results and benefits in the field and making global animal production take the right direction in the future.
References upon request.
Cryptosporidia in calves – chickens can help
By Lea Poppe, Regional Technical Manager, EW Nutrition
Diarrhea due to infestation with cryptosporidia is one of the most pressing problems in calf rearing. These protozoa, along with rotaviruses, are now considered the most common pathogens in infectious calf diarrhea. Due to their high resistance and thus limited possible control and prevention measures, they have now overtaken other pathogens such as coronaviruses, salmonellae, and E. coli.
Cryptosporidia show complex development
Cryptosporidia are single-celled intestinal parasites. In calves, Cryptosporidium parvum and Cryptosporidium bovis are most commonly found. C. bovis is normally considered nonpathogenic. Accordingly, the disease known as cryptosporidiosis is caused by C. parvum. The rapid tests for determining the diarrheal pathogens, which are increasingly widespread, are usually unsuitable for distinguishing between the individual strains, which can lead to false positive results.
Resistant in the environment, active in the animal
In the environment, cryptosporidia are distributed as oocysts. The oocysts are only about 5 µm in size and have a very resistant shell. They can remain infectious for up to 6 months in high humidity and moderate temperatures. Drought and extreme temperatures (below -18°C and above 65°C) cause the oocysts to die.
After oral ingestion, the oocysts are reactivated by conditions in the gastrointestinal tract (low pH and body temperature): As sporozoites, the parasites attach to the posterior small intestine, causing diarrhea symptomatology. There, they surround themselves with a special protective membrane, and the complex life cycle continues. Only a few days after infection, reproductive forms are detectable in the calf’s intestine, and excretion of infectious oocysts in the feces begins.
Figure 1 (Olias et al., 2018): Life cycle of cryptosporidia: ingested oocysts release four sporozoites that invade host enterocytes (intestinal epithelial cells). There, they develop into trophozoites before asexual and sexual reproduction ensues, and thin- and thick-walled oocysts are formed. Thick-walled oocysts are excreted through the intestine. Thin-walled oocysts may break apart, and the sporozoites may infect other enterocytes, resulting in relapse or prolonged diarrhea. Infestation of the cells leads to their destruction, resulting in villi atrophy or fusion.
Oocysts bring the disease to the animal
Cryptosporidiosis is transmitted either by direct contact of calves with feces from infected animals or indirectly by ingesting contaminated feed, bedding, or water. Each gram of feces excreted by calves showing symptoms may contain up to 100 million oocysts. According to experimental studies, as few as 17 orally ingested oocysts are sufficient to trigger infection. In addition, some multiplication forms can infect other intestinal cells directly within the intestine and thus further advance the disease by autoinfection.
Cryptosporidiosis caused by cryptosporidia often presents with typical diarrhea symptoms and occurs primarily in calves up to 3 weeks of age. Older calves may also be infected with cryptosporidia but usually show no symptoms. Pathogen excretion and, thus, the spread of disease within the herd is nevertheless likely due to the minimal infectious dose.
Damage to the intestinal wall leads to retardation of growth
Attachment of cryptosporidia to the intestinal wall is associated with an inflammatory reaction, regression and fusion of the intestinal villi, and damage to the microvilli. As a result, nutrient absorption in the small intestine is impaired, and more undigested nutrients enter the colon. The microflora starts a fermentation process with lactose and starch, leading to increased lactate levels in the blood and, thus, hyperacidity in the calf. Faintness, unwillingness to drink, recumbency, and growth disorders are the consequences.
Diarrhea often occurs late or not at all and, accordingly, is not considered the main symptom of cryptosporidiosis. When diarrhea occurs, it lasts about 1-2 weeks. The feces are typically watery, greenish-yellow, and are often described as foul-smelling. Due to diarrhea, there is a loss of electrolytes and dehydration.
Studies show: Cryptosporidia are the most prevalent diarrheal pathogens
Several studies in different regions, which examined calf diarrhea and its triggers in more detail, came to a similar conclusion: Cryptosporidia are one of the most common causes of calf diarrhea. In addition, mixed infections often occur.
DL = days of life WL = weeks of life n.m. = not mentioned EP = enteropathogen
Cryptosporidia reduces profit
Infection with cryptosporidia and sometimes subsequent diarrhea entails treatment of the animals and generates costs (veterinarian, medication, electrolyte drinks). In addition, poorer feed conversion, lower growth, and animal losses result in lower production efficiency.
A Scottish study shows 34 kg less gain in the first six months of life compared to healthy calves in beef calves that experienced severe cryptosporidiosis in the first three weeks of life. Similar results are described in lambs, also a susceptible species to cryptosporidia. These studies suggest a long-term negative effect of cryptosporidia on growth performance and production efficiency.
Here’s how you can support your calves against cryptosporidia
High resistance of the pathogens to environmental influences, a very low necessary infection dose combined with an elevated excretion of infectious oocysts, and the possibility of autoinfection make cryptosporidia tough opponents. This is also reflected in their worldwide distribution.
What is the treatment?
Suitable drugs for the treatment of cryptosporidiosis are currently unavailable on the market. The only medicine that can be used in case of cryptosporidiosis infestation may only be administered to calves that have had diarrhea symptoms for 24 hours or less. Accordingly, this agent is usually used only for prevention. Scientific studies on its effectiveness are contradictory; some suggest that it merely delays the onset of the disease. In addition, it is not always easy to use due to the exact dosage that must be followed. Doubling the dose (sometimes happening already due to incorrectly observed intervals between doses) can lead to a toxic overdose.
Accordingly, only the symptoms of the disease – diarrhea with its accompanying symptoms – can be treated. Electrolyte and water losses must be continuously compensated with the help of a high-quality electrolyte drink. The buffer substances contained also reduce the hyperacidity of the blood caused by faulty fermentation in the intestines. For successful treatment, the electrolyte drink should be given in addition to the milk drink. Under no circumstances should the feeding of milk or milk replacer be discontinued because the sick calf urgently needs energy and nutrients. Opinions to the contrary are outdated.
As always: prevention is better than treatment
To make it more difficult for cryptosporidiosis to spread from the outset, it is worth looking at the risk factors. These include direct contact with other calves and general herd size. Furthermore, organic farms seem to have more problems with cryptosporidia. Weather also influences calves born during warmer and, at the same time, wetter weather periods (temperature-humidity index) often get sick.
Due to the limited possibilities for treatment, prevention is of greater importance. For other diarrheal pathogens such as rotavirus, coronavirus, and E. coli, it has become established practice to vaccinate dams to achieve better passive immunization of the calf. However, commercial vaccination against cryptosporidia is not currently available, making dam vaccination as unavailable as calf vaccination.
Accordingly, optimal colostrum management is the first way to protect the calf from cryptosporidia infection. This also confirms the general discussion on the Failure of Passive Transfer: various studies suggest that calves with poor immunoglobulin supply suffer from diarrhea more frequently than calves with good supply, although a concrete link to cryptosporidia itself cannot always be established with certainty.
Furthermore, it is essential to break the chain of infection within farms. In addition to the separate housing of the calves, it is necessary to ensure consistent hygiene. One should take advantage of the pathogen’s weakness as well as its sensitivity to high temperatures and ensure that the water temperature is sufficiently high when cleaning the calf pens and calving area. When disinfecting afterward, it is crucial to consider the spectrum of activity of the agent used, as not all are effective against cryptosporidia.
Egg immunoglobulins support animals against cryptosporidia
Egg immunoglobulins were initially designed to help chicks get started. In this process, hens form antibodies against pathogens they are confronted with. As studies have shown, this also works with cryptosporidia. Cama and Sterling (1991) tested their produced antibodies in the neonatal mouse model and achieved a significant (P≤0.001) reduction in parasites there. Kobayashi et al. (2004) registered decreased binding of sporozoites to the intestinal cell model and their decreased viability in addition to oocyst reduction.
In the IRIG Research Institute (2009, unpublished), feeding egg powder with immunoglobulins against cryptosporidia (10 g/day) to 15 calves reduced oocyst excretion. Before administration, calves excreted an average of 106.42 oocysts/g of feces. After administration of egg powder, only two calves still showed 103.21 oocysts/g feces, and the other 13 of the 15 calves showed no oocyst excretion. All these results are confirmed by positive customer feedback on IgY-based feed supplements.
Egg immunoglobulins and optimal colostrum management as a key solution
Since there are no effective drugs against cryptosporidia, animals must be prophylactically protected against this disease as much as possible. In addition to optimal colostrum management, which means feeding high-quality colostrum (IgG≥50g/L) to the calf as soon as possible after birth, we have products with egg immunoglobulins available to support the calf as a prophylactic against cryptosporidia infestation and thus prevent significant performance losses, especially during rearing.
References
Brainard, J., Hooper, L., McFariane, S., Hammer, C. C., Hunter, P. R., & Tyler, K. (2020). Systemic review of modifiable risk factors shows little evidential support for most current practices in Cryptosporidium management in bovine calves. Parasitology research 119, 3572-3584.
Cama, V. A., and C. R. Sterling. “Hyperimmune Hens as a Novel Source of Anti-Cryptosporidium Antibodies Suitable for Passive Immune Transfer.” University of Arizona. Wiley-Blackwell, January 1, 1991. https://experts.arizona.edu/en/publications/hyperimmune-hens-as-a-novel-source-of-anti-cryptosporidium-antibo.
Kobayashi, C, H Yokoyama, S Nguyen, Y Kodama, T Kimata, and M Izeki. “Effect of Egg Yolk Antibody on Experimental Infection in Mice.” Vaccine 23, no. 2 (2004): 232–35. https://doi.org/10.1016/j.vaccine.2004.05.034.
Lamp, D. O. (25. Januar 2020). Rinder aktuell: Kälberdurchfall durch Kryptosporidien – Hartnäckig und weitverbreitet. BAUERNBLATT, S. 52-53.
Losand, B., Falkenberg, U., Krömker, V., Konow, M., & Flor, J. (2. März 2021). Kälberaufzucht in MV – Alles im grünen Bereich? 30. Milchrindtag Mecklemburg-Vorpommern.
Luginbühl, A., K. Reitt, A. Metzler, M. Kollbrunner, L. Corboz, and P. Deplazes. “Feldstudie Zu Prävalenz Und Diagnostik Von Durchfallerregern Beim Neonaten Kalb Im Einzugsgebiet Einer Schweizerischen Nutztierpraxis.” Schweizer Archiv für Tierheilkunde 147, no. 6 (2005): 245–52. https://doi.org/10.1024/0036-7281.147.6.245.
Olias, P., Dettwiler, I., Hemphill, A., Deplazes, P., Steiner, A., & Meylan, M. (2018). Die Bedeutung der Cryptosporidiose für die Kälbergesundheit in der Schweiz. Schweiz Arch Tierheilkd, Band 160, Heft 6, Juni 2018, 363-374.
Santín, M., Trout, J. M., Xiao, L., Zhou, L., Greiner, E., & Fayer, R. (2004). Prevalence and age-related variation of Cryptosporidium species and genotypes in dairy calves. Veterinary Parasitology 122, 103-117.
Shaw, H. J., Innes, E. A., Marrison, L. J., Katzer, F., & Wells, B. (2020). Long-term production effects of clinical cryptosporidiosis in neonatal calves. International Journal for Parasitology 50, 371-376.
Silverlås, C., H. Bosaeus-Reineck, K. Näslund, and C. Björkman. “Is There a Need for Improved Cryptosporidium Diagnostics in Swedish Calves?” International Journal for Parasitology 43, no. 2 (2013): 155–61. https://doi.org/10.1016/j.ijpara.2012.10.009.
Thomson, Sarah, Carly A. Hamilton, Jayne C. Hope, Frank Katzer, Neil A. Mabbott, Liam J. Morrison, and Elisabeth A. Innes. “Bovine Cryptosporidiosis: Impact, Host-Parasite Interaction, and Control Strategies.” Veterinary Research 48, no. 1 (2017). https://doi.org/10.1186/s13567-017-0447-0.
Uhde, F., Kaufmann, T., Sager, H., Albini, S., Zanoni, R., & Schelling, E. (2008). Prevalence of four enteropathogens in the feces of young diarrhoeic dairy calves in Switzerland. Veterinary Record (163), 362-366.
Coughing calves? How to save costs and prevent respiratory disease
By Judith Schmidt, Product Manager On Farm Solutions
There will always be germs in barns. Yet, calves are particularly susceptible to lung viruses and bacteria that attack the respiratory systems. What can we do to prevent calf flu?
Coughing in calves is one of the most obvious signs of illness. It should be taken seriously – calves are important for the profitability of farms. Calf flu not only leads to treatment costs but also has long-term consequences, such as weak daily gains, delayed lactation, lower milk yield, reduced fertility, and increased susceptibility to other diseases.
Respiratory disease in calves: recognize the symptoms and protect their lung health
Calves are much more sensitive to respiratory diseases than many other animals. Why? One major cause is that calves are born with immature lungs. The lungs are only fully developed at about one year of age. In addition, calves generally have small lungs relative to their body size. Furthermore, the immunological gaps around the second month of life are decisive. During this phase, the number of maternal antibodies in the calf´s blood decreases, while the calf´s own immune system is still slowly building up.
Symptoms of calf flu
1) Cough
A very easy-to-recognize sign of a developing calf flu is coughing. Coughing can also be caused by changes in weather, stress, or an unsuitable barn climate, but coughing should always be monitored, and animals should be checked for other symptoms.
2) Respiratory distress
Sick calves breathe heavily and show an increased respiratory rate. Even at rest, this can be more than forty breaths per minute, ranging from a slight acceleration of breathing to severe respiratory distress and breathing through the open mouth. Mouth breathing can be the first indication of lung damage.
3) Eye and nose discharge
Calf flu not only shows its symptoms in the internal respiratory tract but also in the eyes and nose through clear, watery discharge. In later stages, bacterial infections can also cause purulent discharge. The animal’s gaze is not clear and rather “sleepy.”
4) Body posture
Calf flu often manifests itself by drooping ears or an overall low head posture, as the calves are dull and weak. They are inactive and separate themselves from the group. They also lie down and standing up is delayed.
5) Reduced water and feed intake
Due to their physical condition, animals suffering from flu tend to take in only little feed and water or do not eat and/or drink at all. The logical consequence is a weakening of the animals. In case of doubt, one should actively water and feed the animals.
Economic significance of respiratory disease in calves
Influenza in cattle and calves is a herd disease and often causes serious financial losses. Losses are caused by pronounced performance decreases, developmental disorders of the animals, and treatment costs. Significantly reduced daily gains have beendemonstrated for fattening animals.
Next to diarrheal diseases, calf flu causes the highest treatment and follow-up costs for calves. A study by the Chamber of Agriculture of Lower Saxony (Germany) found that farmers had to spend between 83 and 204 euros per sick calf, depending on the severity of the disease.
4 tips to save costs and tackle calf flu with less antibiotics use
1) Offer a stable climate
Warm, damp barns, as well as overcrowded and poorly ventilated ones, weaken the calf´s defense mechanisms. Temperature fluctuations of more than 10°C between day and night also favor the development of calf flu. It is important to keep the calves’ environment free of dust and draughts. This can be achieved by adjusting the air exchange rate.
In addition, the humidity in barns without a heating system should be between 60 and 80 percent. Data loggers help to keep an eye on the climate in the barn. They make it possible to check how the outdoor climate and ventilation affect the climate conditions in the barn.
2) Hygiene-sensitive calving management
Attention should be paid to calving management. The long-term health of the animal is already predetermined in the calving pen. If several cows calve at the same time or if calving pens are not mucked out regularly, harmful germs will accumulate. In other words: if a calf is born into a dirty box, it will absorb many germs through its mucous membranes.
3) Avoid stress
It is crucial to minimize stress from causes such as transport, re-housing, feed changes, group formation, dehorning, and weaning. These events should be spaced out as far as possible and should never occur simultaneously.
4) Prevention through supplementary feed
In the winter months, when the weather is cold and damp and constantly changing, calf flu incidence skyrockets. Now, it is imperative to strengthen the calf´s respiratory tract from the beginning. EW Nutrition’s Bronchogol Liquid is a herbal concentrate that supports respiration and stabilizes the physiological defense system in the respiratory organs.
Bronchogol liquid supports young calves in stressful situations, such as critical weather transition periods (autumn-winter; winter-spring) and housing changes, and when they suffer from calf flu. The product is based on a proprietary mixture of phytomolecules. By stimulating the cilia in the respiratory tract, the phytomolecules promote the transport of mucus and facilitate expectoration.